x*x*x
sqrt(x)
|
\newcommand{\Bold}[1]{\mathbf{#1}}\sqrt{x}
\newcommand{\Bold}[1]{\mathbf{#1}}\sqrt{x}
|
x*x*x*x*x*x*x
|
\newcommand{\Bold}[1]{\mathbf{#1}}x^{7}
\newcommand{\Bold}[1]{\mathbf{#1}}x^{7}
|
23^47
|
\newcommand{\Bold}[1]{\mathbf{#1}}10027860709531471276608129612323653414238264145365258534666014247
\newcommand{\Bold}[1]{\mathbf{#1}}10027860709531471276608129612323653414238264145365258534666014247
|
var(x)=('x')
|
|
(x+1)^7
|
\newcommand{\Bold}[1]{\mathbf{#1}}{(x + 1)}^{7}
\newcommand{\Bold}[1]{\mathbf{#1}}{(x + 1)}^{7}
|
expand((x+1)^7)
|
\newcommand{\Bold}[1]{\mathbf{#1}}x^{7} + 7 \, x^{6} + 21 \, x^{5} + 35 \, x^{4} + 35 \, x^{3} + 21 \, x^{2} + 7 \, x + 1
\newcommand{\Bold}[1]{\mathbf{#1}}x^{7} + 7 \, x^{6} + 21 \, x^{5} + 35 \, x^{4} + 35 \, x^{3} + 21 \, x^{2} + 7 \, x + 1
|
(x+1)^7 - (x-1)^7
|
\newcommand{\Bold}[1]{\mathbf{#1}}-{(x - 1)}^{7} + {(x + 1)}^{7}
\newcommand{\Bold}[1]{\mathbf{#1}}-{(x - 1)}^{7} + {(x + 1)}^{7}
|
expand((x+1)^7 - (x-1)^7)
|
\newcommand{\Bold}[1]{\mathbf{#1}}14 \, x^{6} + 70 \, x^{4} + 42 \, x^{2} + 2
\newcommand{\Bold}[1]{\mathbf{#1}}14 \, x^{6} + 70 \, x^{4} + 42 \, x^{2} + 2
|
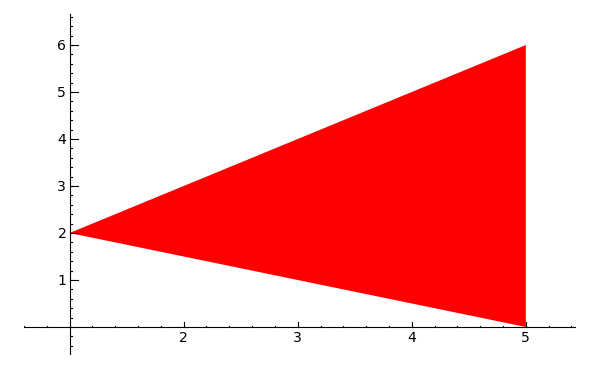
G = plot(cos, -5, 5, thickness=5, rgbcolor=(0.5,1,0.5))
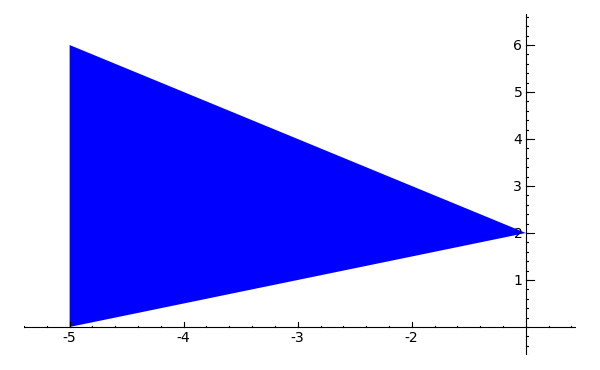
P = polygon([[1,2], [5,6], [5,0]], rgbcolor=(1,0,0))
P # show it
|
|
|
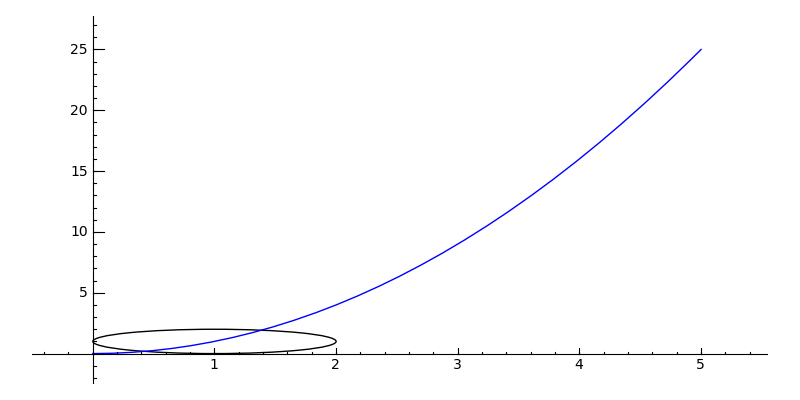
circle((1,1), 1) + plot(x^2, (0,5))
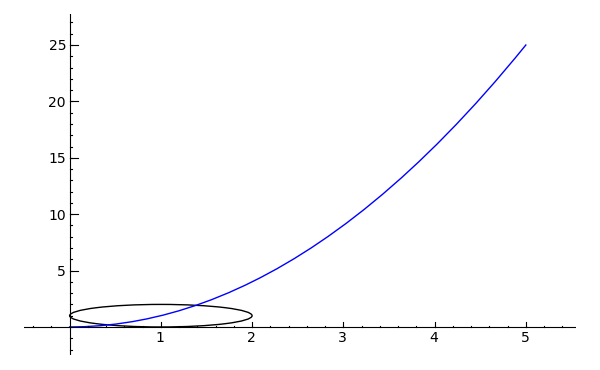
|
show(circle((1,1), 1) + plot(x^2, (0,5)), aspect_ratio=1)
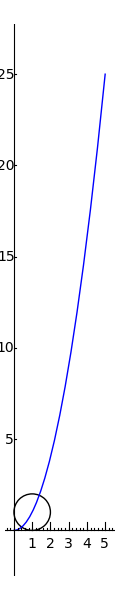
|
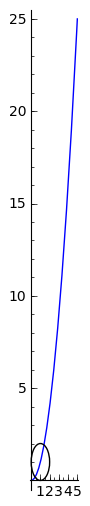
show(circle((1,1), 1) + plot(x^2, (0,5)), aspect_ratio=2)
|
show(circle((1,1), 1) + plot(x^2, (0,5)), figsize=[8,4])
|
Q = polygon([(-x,y) for x,y in P[0]], rgbcolor=(0,0,1))
Q # show it
|
H = G + P + Q
print H
Graphics object consisting of 3 graphics primitives Graphics object consisting of 3 graphics primitives |
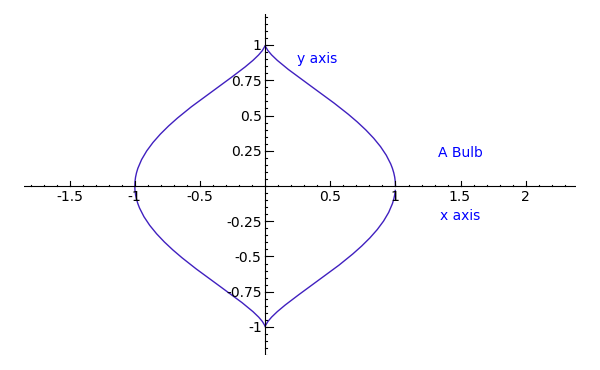
L = [[cos(pi*i/100)^3,sin(pi*i/100)] for i in range(200)]
p = line(L, rgbcolor=(1/4,1/8,3/4))
t = text('A Bulb', (1.5, 0.25))
x = text('x axis', (1.5,-0.2))
y = text('y axis', (0.4,0.9))
g = p+t+x+y
g.show(xmin=-1.5, xmax=2, ymin=-1, ymax=1)
|
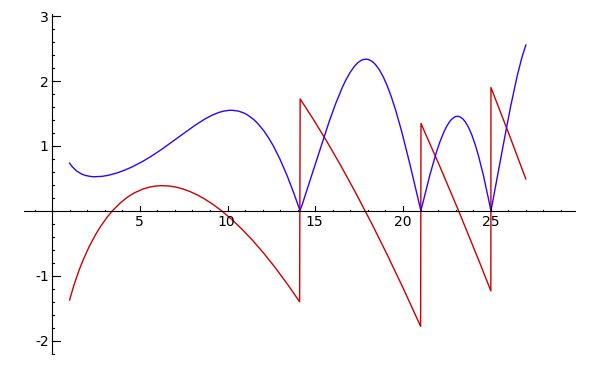
i = CDF.0 # define i this way for maximum speed.
p1 = plot(lambda t: arg(zeta(0.5+t*i)), 1,27,rgbcolor=(0.8,0,0))
p2 = plot(lambda t: abs(zeta(0.5+t*i)), 1,27,rgbcolor=hue(0.7))
print p1 + p2
Graphics object consisting of 2 graphics primitives Graphics object consisting of 2 graphics primitives |
p1 + p2 # display it
|
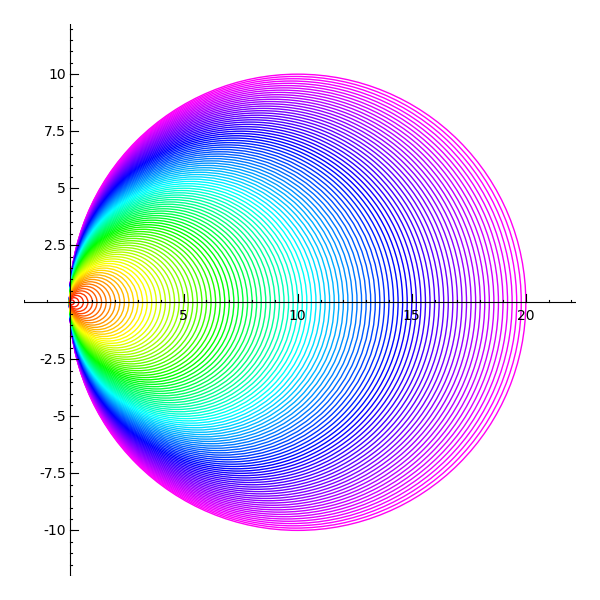
show(sum(circle((i,0), i, hue=sin(i/10)) for i in [10,9.9,..,0]), aspect_ratio=1)
|
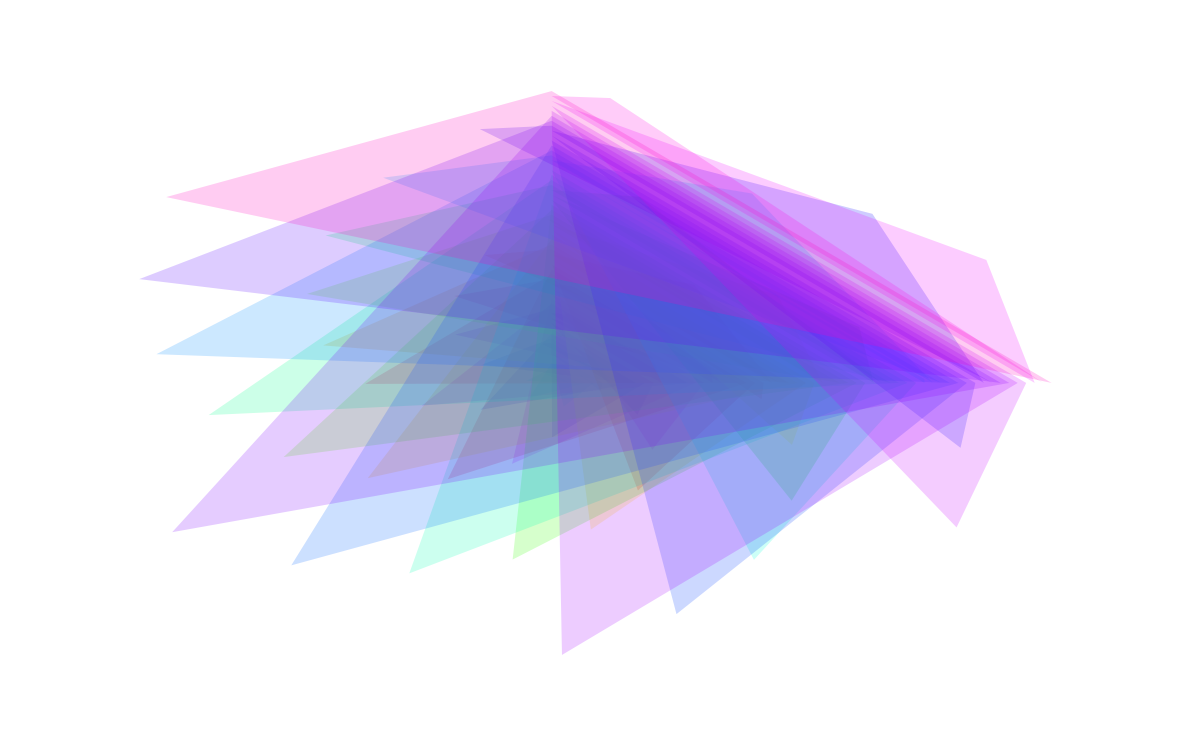
g = Graphics()
for i in range(60):
p = polygon([(i*cos(i),i*sin(i)), (0,i), (i,0)],\
rgbcolor=hue(i/40+0.4), alpha=0.2)
g = g + p
g.show(dpi=200, axes=False)
|
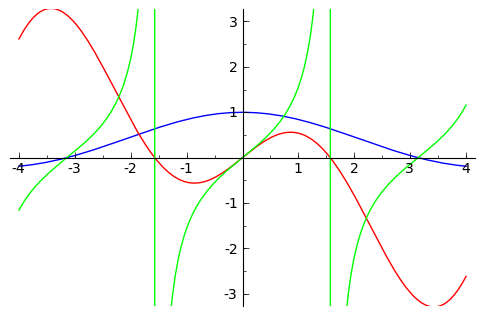
x = var('x')
P = plot(sin(x)/x, -4,4, rgbcolor=(0,0,1)) + \
plot(x*cos(x), -4,4, rgbcolor=(1,0,0)) + \
plot(tan(x),-4,4,rgbcolor=(0,1,0))
P.show(ymin=-pi,ymax=pi)
|
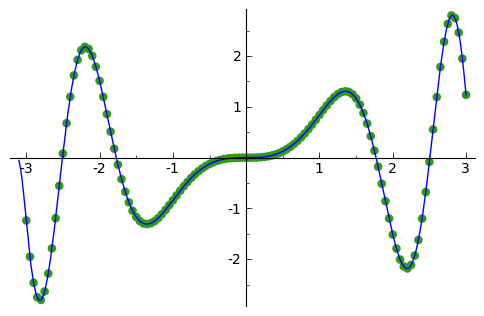
y(x) = x*sin(x^2)
v = [(x, y(x)) for x in [-3,-2.95,..,3]]
show(points(v, rgbcolor=(0.2,0.6, 0.1), pointsize=30) + plot(spline(v), -3.1, 3))
|
x = var('x')
g1 = plot(cos(20*x)*exp(-2*x), 0, 1)
g2 = plot(2*exp(-30*x) - exp(-3*x), 0, 1)
show(graphics_array([g1, g2], 2, 1), xmin=0)
Traceback (click to the left of this block for traceback)
...
TypeError: no canonical coercion from <type 'str'> to Callable
function ring with arguments (x,)
Traceback (most recent call last): show(graphics_array([g1, g2], 2, 1), xmin=0)
File "expression.pyx", line 2854, in sage.symbolic.expression.Expression.__call__ (sage/symbolic/expression.cpp:14148)
File "/home/sage/sage_install/sage/local/lib/python2.6/site-packages/sage/symbolic/callable.py", line 448, in _call_element_
return SR(_the_element.substitute(**d))
File "expression.pyx", line 2702, in sage.symbolic.expression.Expression.substitute (sage/symbolic/expression.cpp:13504)
File "expression.pyx", line 1496, in sage.symbolic.expression.Expression.coerce_in (sage/symbolic/expression.cpp:9538)
File "parent_old.pyx", line 331, in sage.structure.parent_old.Parent._coerce_ (sage/structure/parent_old.c:4632)
File "parent.pyx", line 429, in sage.structure.parent.Parent.coerce (sage/structure/parent.c:4765)
TypeError: no canonical coercion from <type 'str'> to Callable function ring with arguments (x,)
|
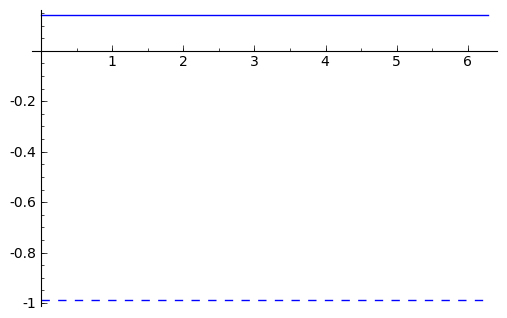
g1 = plot(sin(x), 0, 2*pi)
g2 = plot(cos(x), 0, 2*pi, linestyle = "--")
g1 + g2 # show their sum
|
f = (x-3)*(x-5)*(x-7)+40
P = line([(2,0),(2,f(2))], rgbcolor=(0,0,0))
P += line([(8,0),(8,f(8))], rgbcolor=(0,0,0))
P += polygon([(2,0),(2,f(2))] + [(x, f(x)) for x in [2,2.1,..,8]] + [(8,0),(2,0)], rgbcolor=(0.8,0.8,0.8))
P += text("$\\int_{a}^b f(x) dx$", (5, 20), fontsize=16, rgbcolor=(0,0,0))
P += plot(f, 1, 8.5, thickness=3)
P # show the result
Traceback (click to the left of this block for traceback)
...
TypeError: 'sage.rings.real_mpfr.RealNumber' object is not callable
Traceback (most recent call last): P # show the result
File "", line 1, in <module>
File "/tmp/tmpXGLocD/___code___.py", line 4, in <module>
P = line([(_sage_const_2 ,_sage_const_0 ),(_sage_const_2 ,f(_sage_const_2 ))], rgbcolor=(_sage_const_0 ,_sage_const_0 ,_sage_const_0 ))
TypeError: 'sage.rings.real_mpfr.RealNumber' object is not callable
|
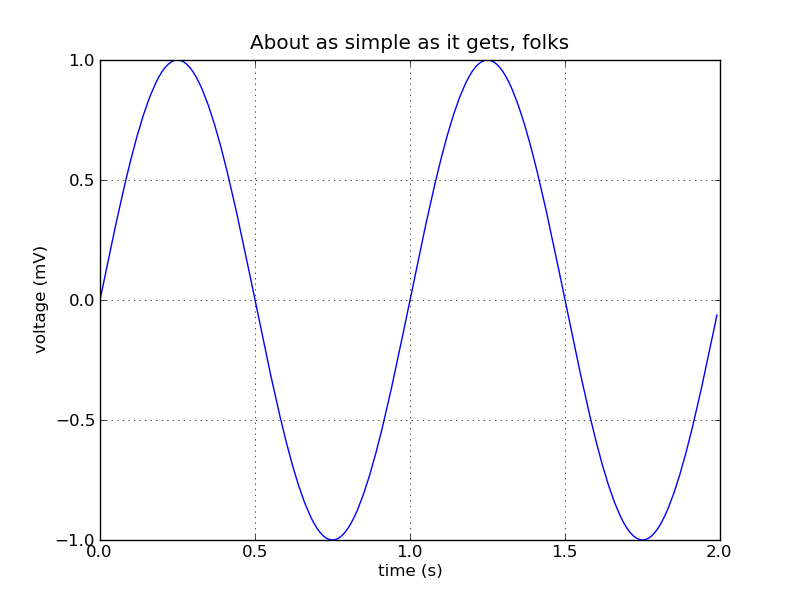
from pylab import *
t = arange(0.0, 2.0, 0.01)
s = sin(2*pi*t)
P = plot(t, s, linewidth=1.0)
xl = xlabel('time (s)')
yl = ylabel('voltage (mV)')
t = title('About as simple as it gets, folks')
grid(True)
savefig('sage.png')
|
reset()
|
|
p = plot(sin(x), (x, 0,2*pi))
Q = loads(dumps(p))
|
|
f(x) = sin(x)
g(x) = sin(2*x)
h(x) = sin(4*x)
p1 = plot(f,-2*pi,2*pi,rgbcolor=hue(0.5))
p2 = plot(g,-2*pi,2*pi,rgbcolor=hue(0.9))
p3 = parametric_plot((f,g),0,2*pi,rgbcolor=hue(0.6))
p4 = parametric_plot((f,h),0,2*pi,rgbcolor=hue(1.0))
/usr/local/sage/local/lib/python2.6/site-packages/sage/all_notebook.py:8\
: DeprecationWarning: variable ranges to parametric_plot must be given
as tuples, like (2,4) or (t,2,3)

/usr/local/sage/local/lib/python2.6/site-packages/sage/all_notebook.py:1\
: DeprecationWarning: variable ranges to parametric_plot must be given
as tuples, like (2,4) or (t,2,3)
  """nodoctest"""
/usr/local/sage/local/lib/python2.6/site-packages/sage/all_notebook.py:8: DeprecationWarning: variable ranges to parametric_plot must be given as tuples, like (2,4) or (t,2,3) /usr/local/sage/local/lib/python2.6/site-packages/sage/all_notebook.py:1: DeprecationWarning: variable ranges to parametric_plot must be given as tuples, like (2,4) or (t,2,3) """nodoctest""" |
graphics_array(((p1,p2),(p3,p4)))
|
\newcommand{\Bold}[1]{\mathbf{#1}}\hbox{Graphics Array of size 2 x 2}
\newcommand{\Bold}[1]{\mathbf{#1}}\hbox{Graphics Array of size 2 x 2}
|
ga.show()
Traceback (click to the left of this block for traceback)
...
NameError: name 'ga' is not defined
Traceback (most recent call last):
File "<stdin>", line 1, in <module>
File "_sage_input_14.py", line 9, in <module>
open("___code___.py","w").write("# -*- coding: utf-8 -*-\n" + _support_.preparse_worksheet_cell(base64.b64decode("Z2Euc2hvdygp"),globals())+"\n"); execfile(os.path.abspath("___code___.py"))
File "", line 1, in <module>
File "/tmp/tmpsNLhbp/___code___.py", line 2, in <module>
ga.show()
File "", line 1, in <module>
NameError: name 'ga' is not defined
|
g.show()
|
\newcommand{\Bold}[1]{\mathbf{#1}}x \ {\mapsto}\ \sin\left(2 \, x\right)
\newcommand{\Bold}[1]{\mathbf{#1}}x \ {\mapsto}\ \sin\left(2 \, x\right)
|
t = var('t')
parametric_plot( (sin(t), sin(2*t)), 0, 2*pi, rgbcolor=hue(0.6) )
parametric_plot((1, t), 0, 4)
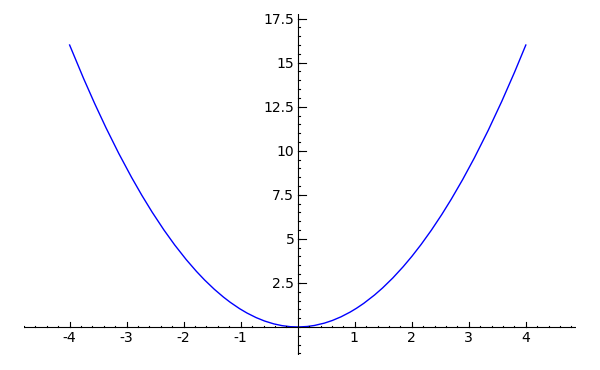
parametric_plot((t, t^2), -4, 4)
|
t = var('t')
parametric_plot( (sin(t), sin(2*t)), 0, 2*pi, rgbcolor=hue(0.6) )
parametric_plot((1, t), 0, 4)
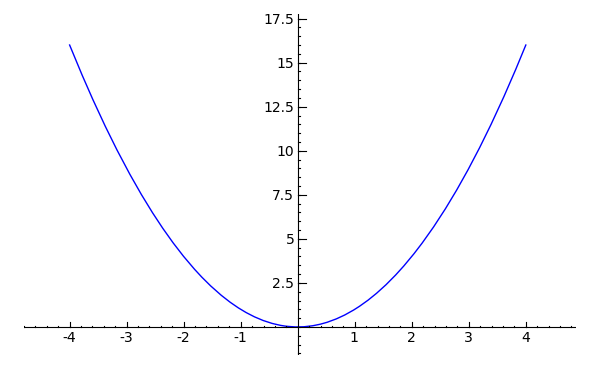
parametric_plot((t, t^2), -4, 4)
|
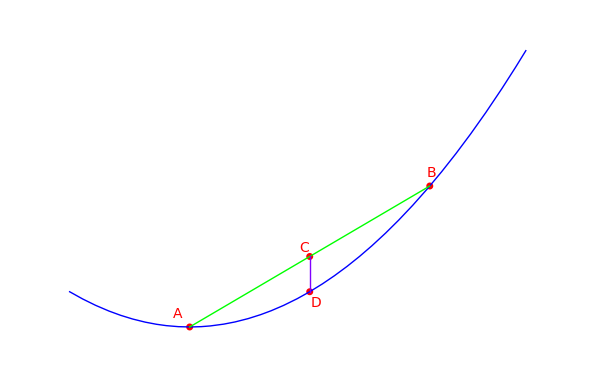
p = plot(x^2, (-0.5, 1.4)) + line([(0,0), (1,1)], rgbcolor='green')
p += line([(0.5, 0.5), (0.5, 0.5^2)], rgbcolor='purple')
p += point(((0, 0), (0.5, 0.5), (0.5, 0.5^2), (1, 1)), rgbcolor='red', pointsize=20)
p += text('A', (-0.05, 0.1), rgbcolor='red')
p += text('B', (1.01, 1.1), rgbcolor='red')
p += text('C', (0.48, 0.57), rgbcolor='red')
p += text('D', (0.53, 0.18), rgbcolor='red')
p.show(axes=False, xmin=-0.5, xmax=1.4, ymin=0, ymax=2)
|
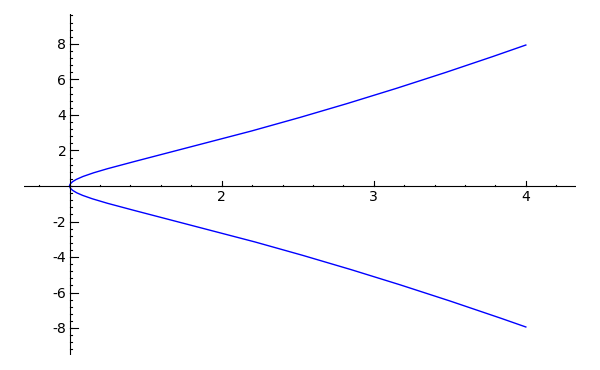
def h1(x): return abs(sqrt(x^3 - 1))
def h2(x): return -abs(sqrt(x^3 - 1))
P = plot([h1, h2], 1,4)
P # show the result
|
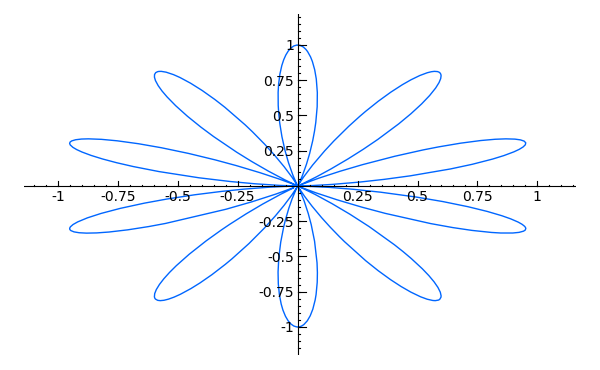
polar_plot(sin(5*x)^2, 0, 2*pi, rgbcolor=hue(0.6))
|
polar_plot(abs(sqrt(1 - sin(x)^2)), 0, 2*pi, rgbcolor=hue(1.0))
|
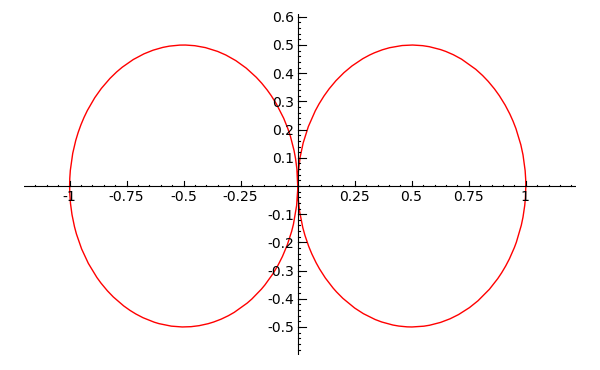
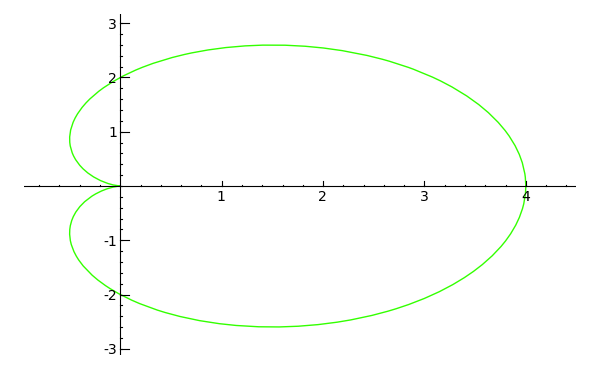
polar_plot(2 + 2*cos(x), 0, 2*pi, rgbcolor=hue(0.3))
|
['#ff0000', '#ffda00', '#48ff00', '#00ff91', '#0091ff', '#4800ff',
'#ff00da']
|
|
[(1.0, 0.0, 0.0), (1.0, 0.8571428571428571, 0.0), (0.28571428571428581,
1.0, 0.0), (0.0, 1.0, 0.57142857142857162), (0.0, 0.57142857142857162,
1.0), (0.28571428571428559, 0.0, 1.0), (1.0, 0.0, 0.85714285714285676)]
|
|
a = animate([circle((i,i), 1-1/(i+1), hue=i/10) for i in srange(0,2,0.2)],
xmin=0,ymin=0,xmax=2,ymax=2,figsize=[2,2])
a.show() # optional -- requires convert command
|
a = animate([sin(x + float(k)) for k in srange(0,2*pi,0.3)],
xmin=0, xmax=2*pi, figsize=[2,1])
a
|
\newcommand{\Bold}[1]{\mathbf{#1}}\hbox{Animation with 21 frames}
\newcommand{\Bold}[1]{\mathbf{#1}}\hbox{Animation with 21 frames}
|
a.show() # optional -- requires convert command
a[:5].show() # optional
|
a.show(delay=50, iterations=4) # optional

|
step = 0.1
L = Graphics()
v = []
for i in srange(0,1,step):
L += line([(i,i^2),(i+step,(i+step)^2)], rgbcolor=(1,0,0),
Traceback (click to the left of this block for traceback)
...
SyntaxError: invalid syntax
Traceback (most recent call last):
File "<stdin>", line 1, in <module>
File "_sage_input_20.py", line 9, in <module>
open("___code___.py","w").write("# -*- coding: utf-8 -*-\n" + _support_.preparse_worksheet_cell(base64.b64decode("c3RlcCA9IDAuMQpMID0gR3JhcGhpY3MoKQp2ID0gW10KZm9yIGkgaW4gc3JhbmdlKDAsMSxzdGVwKToKICAgICAgIEwgKz0gbGluZShbKGksaV4yKSwoaStzdGVwLChpK3N0ZXApXjIpXSwgcmdiY29sb3I9KDEsMCwwKSw="),globals())+"\n"); execfile(os.path.abspath("___code___.py"))
File "", line 1, in <module>
File "/tmp/tmpoErQBt/___code___.py", line 8
^
SyntaxError: invalid syntax
|
a = animate(v, xmin=0, ymin=0)
a.show() # optional -- requires convert command
show(L)
Traceback (click to the left of this block for traceback)
...
NameError: name 'v' is not defined
Traceback (most recent call last):
File "<stdin>", line 1, in <module>
File "_sage_input_21.py", line 9, in <module>
open("___code___.py","w").write("# -*- coding: utf-8 -*-\n" + _support_.preparse_worksheet_cell(base64.b64decode("YSA9IGFuaW1hdGUodiwgeG1pbj0wLCB5bWluPTApCmEuc2hvdygpICMgb3B0aW9uYWwgLS0gcmVxdWlyZXMgY29udmVydCBjb21tYW5kCnNob3coTCk="),globals())+"\n"); execfile(os.path.abspath("___code___.py"))
File "", line 1, in <module>
File "/tmp/tmp2H_qBK/___code___.py", line 3, in <module>
a = animate(v, xmin=_sage_const_0 , ymin=_sage_const_0 )
NameError: name 'v' is not defined
|
a = animate([sin(x + float(k)) for k in srange(0,2*pi,0.7)],
xmin=0, xmax=2*pi, figsize=[2,1])
a.gif() # optional -- requires convert command
a.gif(delay=35, iterations=3) # optional
a.gif(savefile='my_animation.gif') # optional
a.gif(savefile='my_animation.gif', show_path=True) # optional
Animation saved to file /tmp/tmpukLdnq/my_animation.gif. Animation saved to file /tmp/tmpukLdnq/my_animation.gif.   
|
E = EllipticCurve('37a')
v = [E.change_ring(GF(p)).plot(pointsize=30) for p in [97, 101, 103, 107]]
a = animate(v, xmin=0, ymin=0)
|
|
a.show() # optional -- requires convert com
|
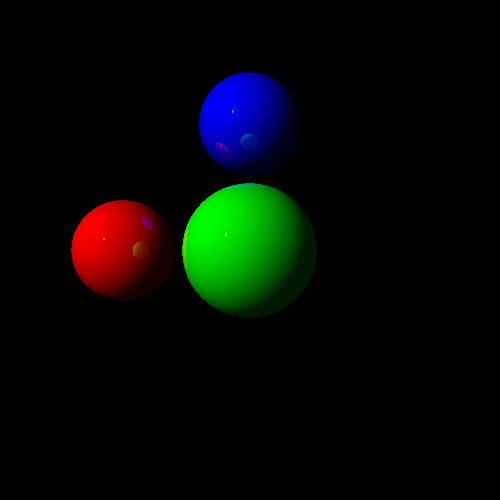
t = Tachyon(xres=500,yres=500, camera_center=(2,0,0))
t.light((4,3,2), 0.2, (1,1,1))
t.texture('t2', ambient=0.1, diffuse=0.9, specular=0.5, opacity=1.0, color=(1,0,0))
t.texture('t3', ambient=0.1, diffuse=0.9, specular=0.5, opacity=1.0, color=(0,1,0))
t.texture('t4', ambient=0.1, diffuse=0.9, specular=0.5, opacity=1.0, color=(0,0,1))
t.sphere((0,0.5,0), 0.2, 't2')
t.sphere((0.5,0,0), 0.2, 't3')
t.sphere((0,0,0.5), 0.2, 't4')
t.show()
|
gnuplot.plot3d_parametric('v^2*sin(u), v*cos(u), v*(1-v)') # optional -- requires gnuplot (not tested, since something pops up).
/usr/local/sage/local/bin/sage-native-execute: 8: gnuplot: not found /usr/local/sage/local/bin/sage-native-execute: 8: gnuplot: not found |
maxima.plot3d ("2^(-u^2 + v^2)", "[u, -3, 3]", "[v, -2, 2]",\
'[plot_format, openmath]') # not tested
maxima.plot3d("atan(-x^2 + y^3/4)", "[x, -4, 4]", "[y, -4, 4]",\
"[grid, 50, 50]",'[plot_format, openmath]') # not tested
Traceback (click to the left of this block for traceback)
...
To enable the Lisp debugger set *debugger-hook* to nil.
Traceback (most recent call last):
File "<stdin>", line 1, in <module>
File "_sage_input_27.py", line 9, in <module>
open("___code___.py","w").write("# -*- coding: utf-8 -*-\n" + _support_.preparse_worksheet_cell(base64.b64decode("bWF4aW1hLnBsb3QzZCAoIjJeKC11XjIgKyB2XjIpIiwgIlt1LCAtMywgM10iLCAiW3YsIC0yLCAyXSIsXAogICAnW3Bsb3RfZm9ybWF0LCBvcGVubWF0aF0nKSAjIG5vdCB0ZXN0ZWQKbWF4aW1hLnBsb3QzZCgiYXRhbigteF4yICsgeV4zLzQpIiwgIlt4LCAtNCwgNF0iLCAiW3ksIC00LCA0XSIsXAogICAiW2dyaWQsIDUwLCA1MF0iLCdbcGxvdF9mb3JtYXQsIG9wZW5tYXRoXScpICMgbm90IHRlc3RlZA=="),globals())+"\n"); execfile(os.path.abspath("___code___.py"))
File "", line 1, in <module>
File "/tmp/tmprifArc/___code___.py", line 3, in <module>
'[plot_format, openmath]') # not tested
File "/usr/local/sage/local/lib/python2.6/site-packages/sage/interfaces/maxima.py", line 1381, in plot3d
self('plot3d(%s)'%(','.join([str(x) for x in args])))
File "/usr/local/sage/local/lib/python2.6/site-packages/sage/interfaces/expect.py", line 1032, in __call__
return cls(self, x, name=name)
File "/usr/local/sage/local/lib/python2.6/site-packages/sage/interfaces/expect.py", line 1451, in __init__
raise TypeError, x
TypeError: Error executing code in Maxima
CODE:
sage0 : plot3d(2^(-u^2 + v^2),[u, -3, 3],[v, -2, 2],[plot_format, openmath])$
Maxima ERROR:
Maxima encountered a Lisp error:
Filesystem error with pathname "/sagenb/sagenbws/maxout.xmaxima".
Either
1) the file does not exist, or
2) we are not allow to access the file, or
3) the pathname points to a broken symbolic link.
Automatically continuing.
To enable the Lisp debugger set *debugger-hook* to nil.
|
maxima.plot3d("[cos(x)*(3 + y*cos(x/2)), sin(x)*(3 + y*cos(x/2)),\
y*sin(x/2)]", "[x, -4, 4]", "[y, -4, 4]",\
'[plot_format, openmath]') # not tested
Traceback (click to the left of this block for traceback)
...
SyntaxError: unexpected character after line continuation character
Traceback (most recent call last):
File "<stdin>", line 1, in <module>
File "_sage_input_28.py", line 9, in <module>
open("___code___.py","w").write("# -*- coding: utf-8 -*-\n" + _support_.preparse_worksheet_cell(base64.b64decode("bWF4aW1hLnBsb3QzZCgiW2Nvcyh4KSooMyArIHkqY29zKHgvMikpLCBzaW4oeCkqKDMgKyB5KmNvcyh4LzIpKSxcCiAgIHkqc2luKHgvMildIiwgIlt4LCAtNCwgNF0iLCAiW3ksIC00LCA0XSIsXAogICAnW3Bsb3RfZm9ybWF0LCBvcGVubWF0aF0nKSAjIG5vdCB0ZXN0ZWQ="),globals())+"\n"); execfile(os.path.abspath("___code___.py"))
File "", line 1, in <module>
File "/tmp/tmpagQzSj/___code___.py", line 2, in <module>
maxima.plot3d("[cos(x)*(3 + y*cos(x/2)), sin(x)*(3 + y*cos(x/2)),\\u000a y*sin(x/2)]", "[x, -4, 4]", "[y, -4, 4]",\\u000a \u0027[plot_format, openmath]\u0027) # not tested
File "", line 1
maxima.plot3d("[cos(x)*(3 + y*cos(x/2)), sin(x)*(3 + y*cos(x/2)),\\u000a y*sin(x/2)]", "[x, -4, 4]", "[y, -4, 4]",\\u000a '[plot_format, openmath]') # not tested
^
SyntaxError: unexpected character after line continuation character
|
x, y = var('x y')
W = plot3d(sin(pi*((x)^2+(y)^2))/2,(x,-1,1),(y,-1,1), frame=False, color='purple', opacity=0.8)
S = sphere((0,0,0),size=0.3, color='red', aspect_ratio=[1,1,1])
show(W + S, figsize=8)
|
|
|
|
|
|