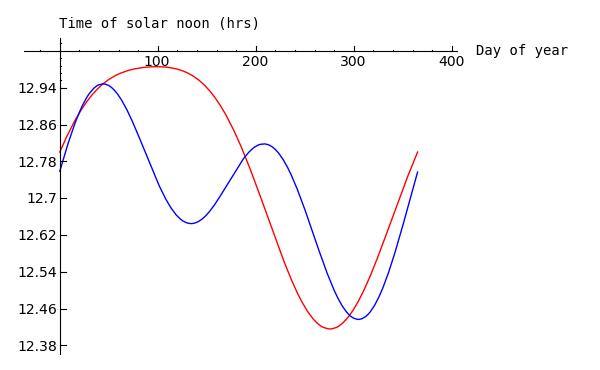
Different calculations of solar noon
References:
[1] D. G. G. de Pury and G. D. Farquhar. Simple scaling of photosynthesis from leaves to canopies without the errors of big-leaf models. Plant Cell and Environment, 20(5):537–557, 1997.
[2] http://www.powerfromthesun.net/chapter3/Chapter3Word.htm#Equation%20of%20Time
var('td')
le = 131 + 9.003/60 # longitude of Howards Springs site
ls = 142.5 # standard longitude of time zone
# Equations in dePury & Farquhar 1997 [1]
Gd = 2/365*pi*(td - 1) # day angle (A18)
eqt = 0.017 + 0.4281*cos(Gd) - 7.351*sin(Gd) - 3.349*cos(2*Gd) - 9.731*sin(Gd) # (A17)
to = 12 + (4*(ls - le) - eqt)/60 # solar noon (A16)
P = plot(to, (td,0,365), color = 'red')
#Equations in [2]
x = 360*(td - 1)/365.242*pi/180 # 3.3
eot = 0.258*cos(x) - 7.416*sin(x) - 3.648*cos(2*x) - 9.228*sin(2*x) # (3.2)
lc = -(le - ls)/16 # longitude correction (3.6, changed sign for east of Greenwich)
lct = 12 - eot/60 + lc # 3.5
P += plot(lct, (td,0,365), color = 'blue')
P.axes_labels(['Day of year','Time of solar noon (hrs)'])
P
|
Why are these different? According to Tom van Niel, the red curve may be neglecting the tilt of the Earth's axis. This is strange,
as dePury & Farquhar 1997 took the equation from Iqbal 1983, which was
obviously published after Woolf, 1968.
|
|