# Taken directly from http://www.sagenb.org/home/pub/297/
|
|
import numpy
import pylab
|
|
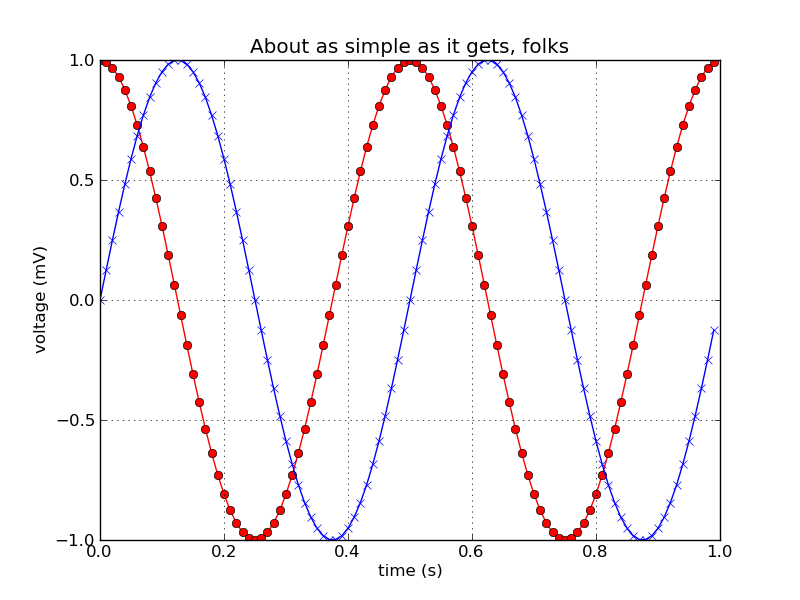
t = numpy.arange(0.0, 1.0, 0.01)
s = numpy.cos(2*2*numpy.pi*t)
z = numpy.sin(2*2*numpy.pi*t)
pylab.plot(t, s, 'ro-', t, z, 'bx-')
pylab.xlabel('time (s)')
pylab.ylabel('voltage (mV)')
pylab.title('About as simple as it gets, folks')
pylab.grid(True)
pylab.savefig('simple_plot')
pylab.legend(('sin','cos'))
pylab.show()
|
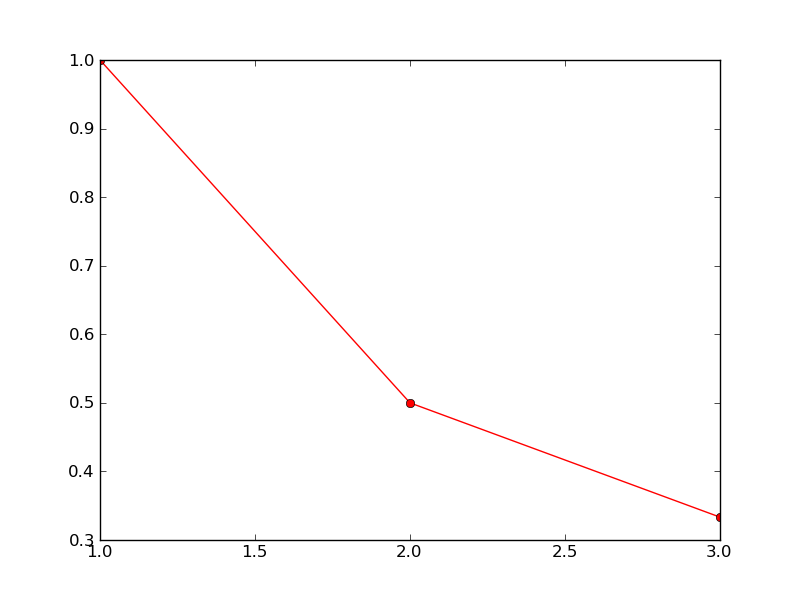
a=[0,1,2,3]
b=[1./a[i] for i in a]
c=numpy.array(b, dtype=float)
d=numpy.ma.fix_invalid(c)
pylab.clf()
pylab.plot(a, d, 'ro-') # thanks schilly!
pylab.savefig('simple_plot2')
pylab.show()

|
xvec = [x for (x,y,m) in zip(a, d.data, d.mask) if not m]
yvec = [y for (x,y,m) in zip(a, d.data, d.mask) if not m]
pylab.clf()
pylab.plot(xvec, yvec, 'ro-')
pylab.savefig('simple_plot3')
pylab.show()
|
|
|
|
|
|
|