# You can modify Plot Range and Boundary Condition Here
PltRange=[[-10,10],[-10,10]];
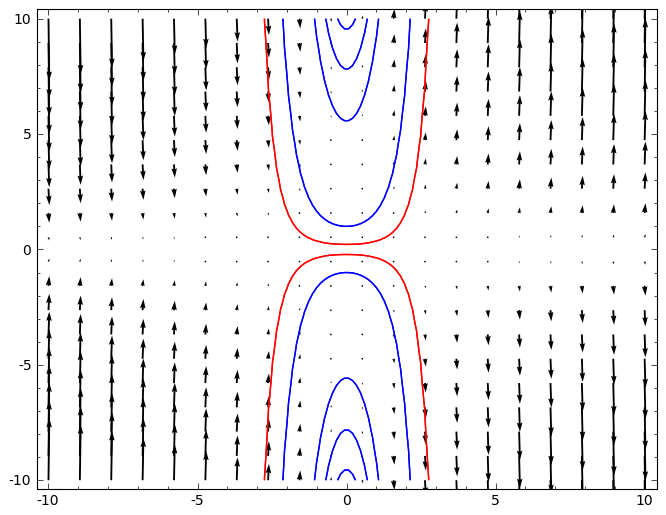
A_goal=0.05;
# This code solves ode y' = x*y boundary value y(0)=0.05
x,y=var('x y');
f_g=plot_vector_field( (1,x*y),(x,PltRange[0][0],PltRange[0][1]),(y,PltRange[1][0],PltRange[1][1]));
fig=f_g;
# plot some specific solution y^2==A*exp(x^2)
for A in range(1,100,30):
f_sp=implicit_plot(y^2==A*exp(x^2),(x,PltRange[0][0],PltRange[0][1]),(y,PltRange[1][0],PltRange[1][1]));
fig+=f_sp;
# plot Goal Solution with correct boundary value
f_goal=implicit_plot(y^2==A_goal*exp(x^2),(x,PltRange[0][0],PltRange[0][1]),(y,PltRange[1][0],PltRange[1][1]),color='red');
fig+=f_goal;
show(fig);