
- 전체
- Python 일반
- Python 수학
- Python 그래픽
- Python 자료구조
- Python 인공지능
- Python 인터넷
- Python SAGE
- wxPython
- TkInter
- iPython
- wxPython
- pyQT
- Jython
- django
- flask
- blender python scripting
- python for minecraft
- Python 데이터 분석
- Python RPA
- cython
- PyCharm
- pySide
- kivy (python)
Python 그래픽 [python 파이썬 2d 그래픽스] The Interesting Python Graphics Libraries for Python Programmers
2021.04.27 21:50
[python 파이썬 2d 그래픽스] The Interesting Python Graphics Libraries for Python Programmers
The Interesting Python Graphics Libraries for Python Programmers
- ·
- 24 Oct 2018
- ·
- ·
- 75876 Views
Python is one of the most popular interpreted programming languages, and its designed to emphasize the readability of the code and the simplicity of the syntax. Python itself has the powerful capability of processing graphics. And in addition to many built-in graphic processing modules, there are many kinds of third-party graphic processing open source softwares provided. In this article, it focuses on some of the more important Python graphics libraries, including image rendering, chart generation, image recognition, and more.
1. Paints Chainer
Paints Chainer is a Python-based comic coloring tool. You just need to click the button after uploading a black-and-white comic sketch, and the AI will generate a colored comic for you automatically.

DEMO: https://paintschainer.preferred.tech/
Github: https://github.com/pfnet/PaintsChainer/wiki/Installation-Guide
2. Face Recognition
Face Recognition is a Python-based face recognition library, which provides a command-line tool allowing you to perform face recognition on images in any folder through the command line.
Face Recognition is based on dlib and has an accuracy of 99.38% on LFW.
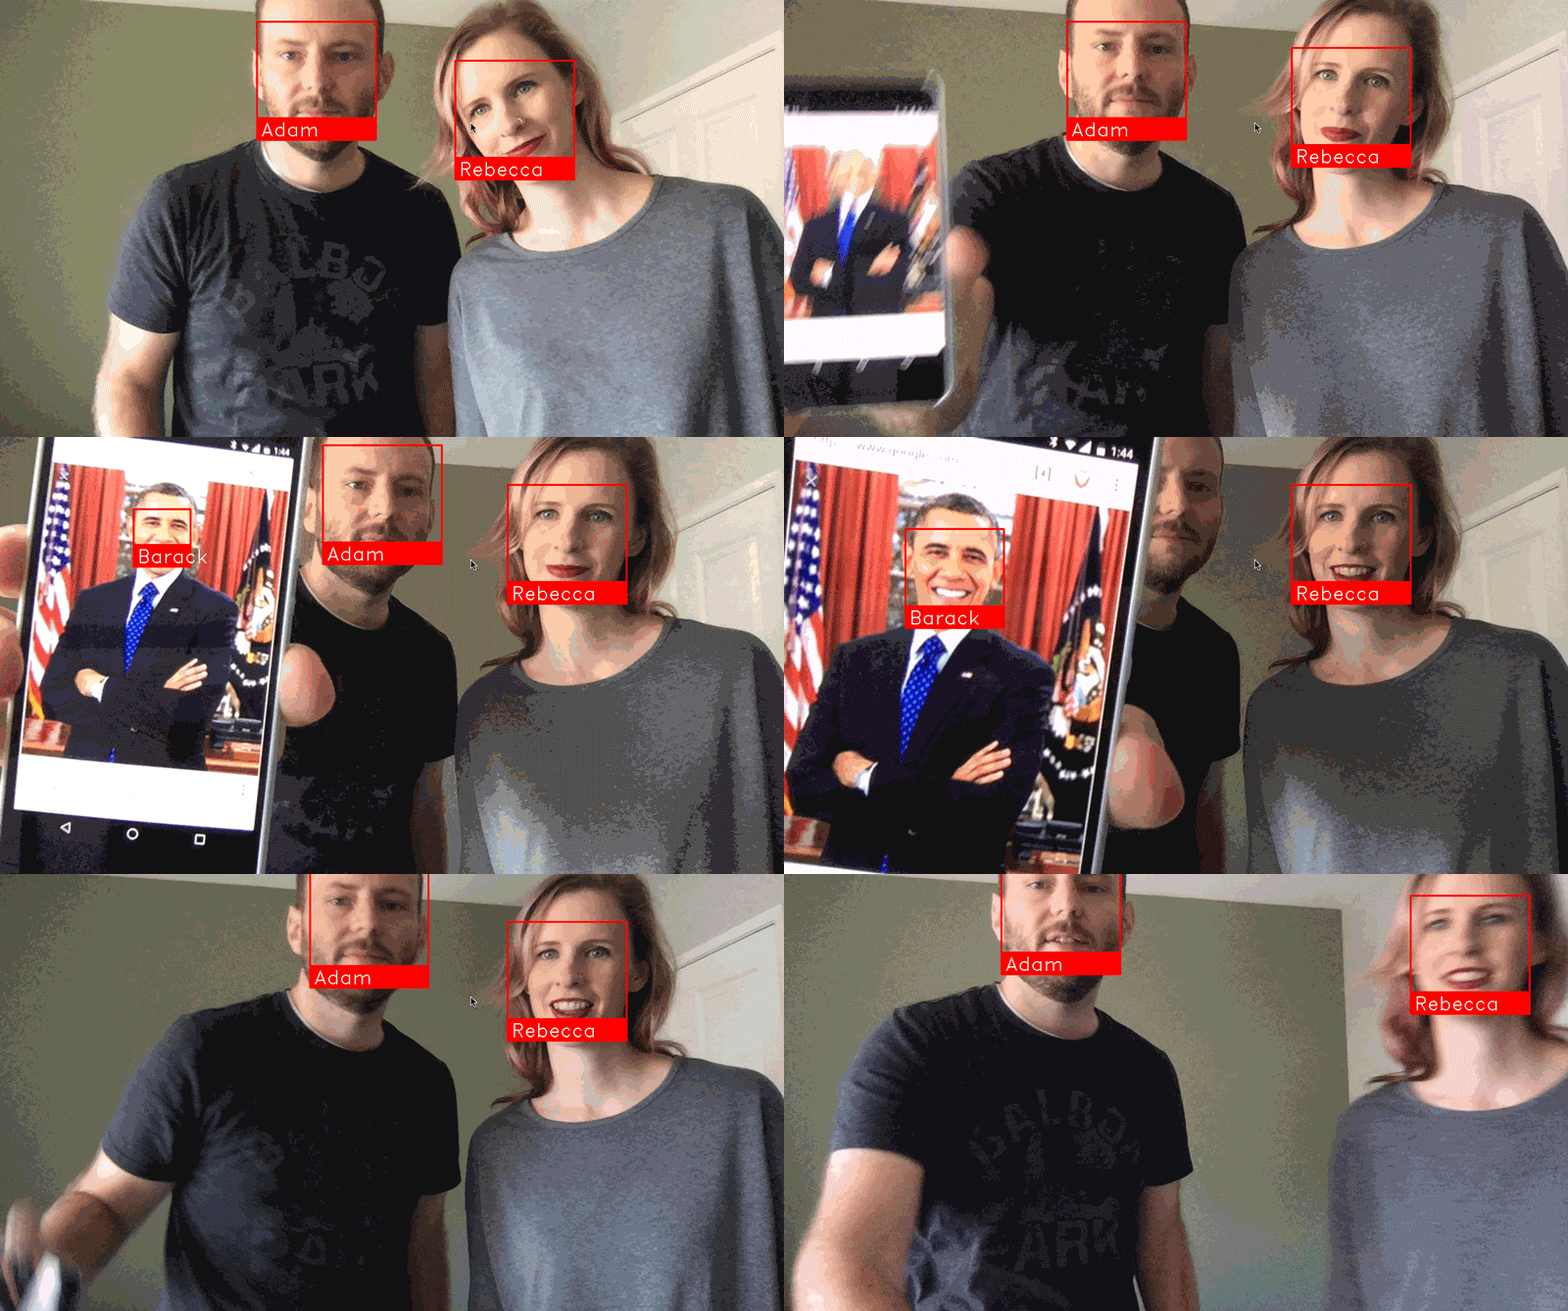
Face Recognition can be used to:
- find all the faces in the pictures;
- find and manipulate facial features in the pictures, and outline the eyes, nose, mouth and chin of each person;
- identify the persons in the images by identify the faces in the images.
- This library can also be used with other libraries for real-time face recognition.
Project homepage: https://github.com/ageitgey/face_recognition
3. Deep Painterly Harmonization
Deep Painterly Harmonization is an image synthesis library based on Python and LUA. The library introduces an algorithm called two-pass which can composite a small image into the master image in a consistent style.

Project homepage: https://github.com/luanfujun/deep-painterly-harmonization
4. Matplotlib
Matplotlib is a Python library developed by John Hunter et al. for drawing 2D graphics. It takes the advantages of the numerical calculation modules Numeric and Numarray in Python, and clones many functions in Matlab to help users obtain high-quality 2D graphics easily. Matplotlib can draw a variety of forms of graphics including usual line graphs, histograms, pie charts, scatter plots and error bars, etc.; it can also custom various properties of graphics such as the type, color, thickness of the line, the size of the font, etc. conveniently; it can support a part of TeX layout commands well, which can display the mathematical formulas in the graphics more decently. Here are many examples.

Official website: https://matplotlib.org/
Matplotlib Tutorial: https://www.tutorialdocs.com/article/python-matplotlib-tutorial.html
5. PLPlot
PLPlot is a cross-platform software package for creating scientific charts. It is based on the C language library and supports various languages (C, C++, Fortran, Java, Python, Perl etc.). PLPlot is also open source and free.

Official website: http://plplot.sourceforge.net/
6. VPython
VPython is a Python-based 3D graphics module. VPython is short for Visual Python, and Visual is a Python 3D graphics module written by David Scherer, a student at Carnegie Mellon University in 2000.
Official website: http://vpython.org/


7. Pyecharts
Pyecharts is a class library for generating Echarts charts. Echarts is a data visualization JS library open-sourced by Baidu. The graphics generated with Echarts are very visual, and pyecharts is designed to interface with Python, making it easy to use data generation diagrams directly in Python. You can use pyecharts to generate standalone web pages, or integrate them in flask and django.

Pyecharts official website: https://github.com/pyecharts/pyecharts
Echarts official website: http://echarts.baidu.com/
8. Bokeh
Bokeh (Bokeh.js) is a Python interactive visualization library, which supports modern web browsers and provides great presentation capabilities. Bokeh is aimed to use the D3.js style to provide an elegant, neat and innovative graphical style, and it also provides high-performance interactivity with large data sets. Bokeh helps to create interactive charts, dashboards, and data applications quickly and easily.

Official website: https://bokeh.pydata.org/en/latest/
Github URL: https://github.com/bokeh/bokeh
9. Pygal
Pygal is a Python library for generating dynamic SVG charts. The various graphics generated with pygal have a variety of default color styles, which are very beautiful.
Official website: http://pygal.org/en/stable/
Github URL: https://github.com/Kozea/pygal/
10. ImageAI
ImageAI is a Python image recognition library, which provides a number of well-trained models and makes it easy to identify and label various objects in a picture. For example, ImageAI can identify people, clouds, mountains, rivers etc. in a landscape image. ImageAI not only supports image recognition, but also supports video recognition and object tracking.

Github URL: https://github.com/OlafenwaMoses/ImageAI
11. Tesseract OCR
Tesseract is an open source OCR engine developed by HP Labs and maintained by Google. Compared to Microsoft Office Document Imaging (MODI), we can train it continuously to enhance its capability of converting image into text. You can also use it as a template to develop an OCR engine that meets your own needs.

Github URL: https://github.com/tesseract-ocr/tesseract
12. Pillow
PIL (Python Imaging Library) is a built-in standard library for Python image processing. It is very powerful, but the API is very easy to use. Pillow is a compatible version created on top of PIL, and it not only supports the latest Python 3.x, but also adds many new features, so we can install Pillow directly.
Github URL: https://github.com/python-pillow/Pillow
[출처] https://www.tutorialdocs.com/article/best-python-graphics-libraries.html
광고 클릭에서 발생하는 수익금은 모두 웹사이트 서버의 유지 및 관리, 그리고 기술 콘텐츠 향상을 위해 쓰여집니다.
