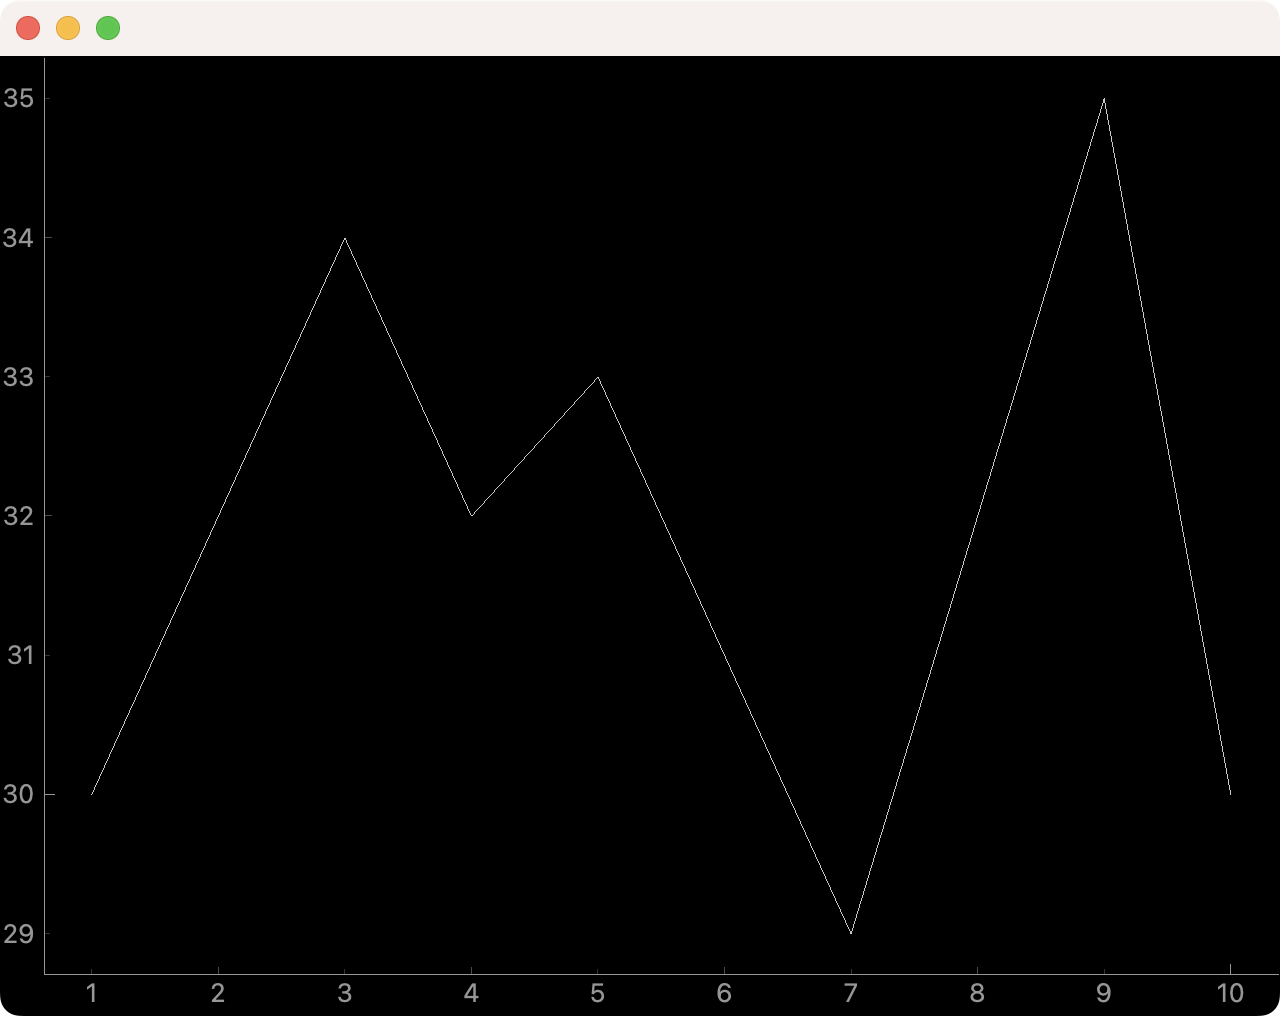
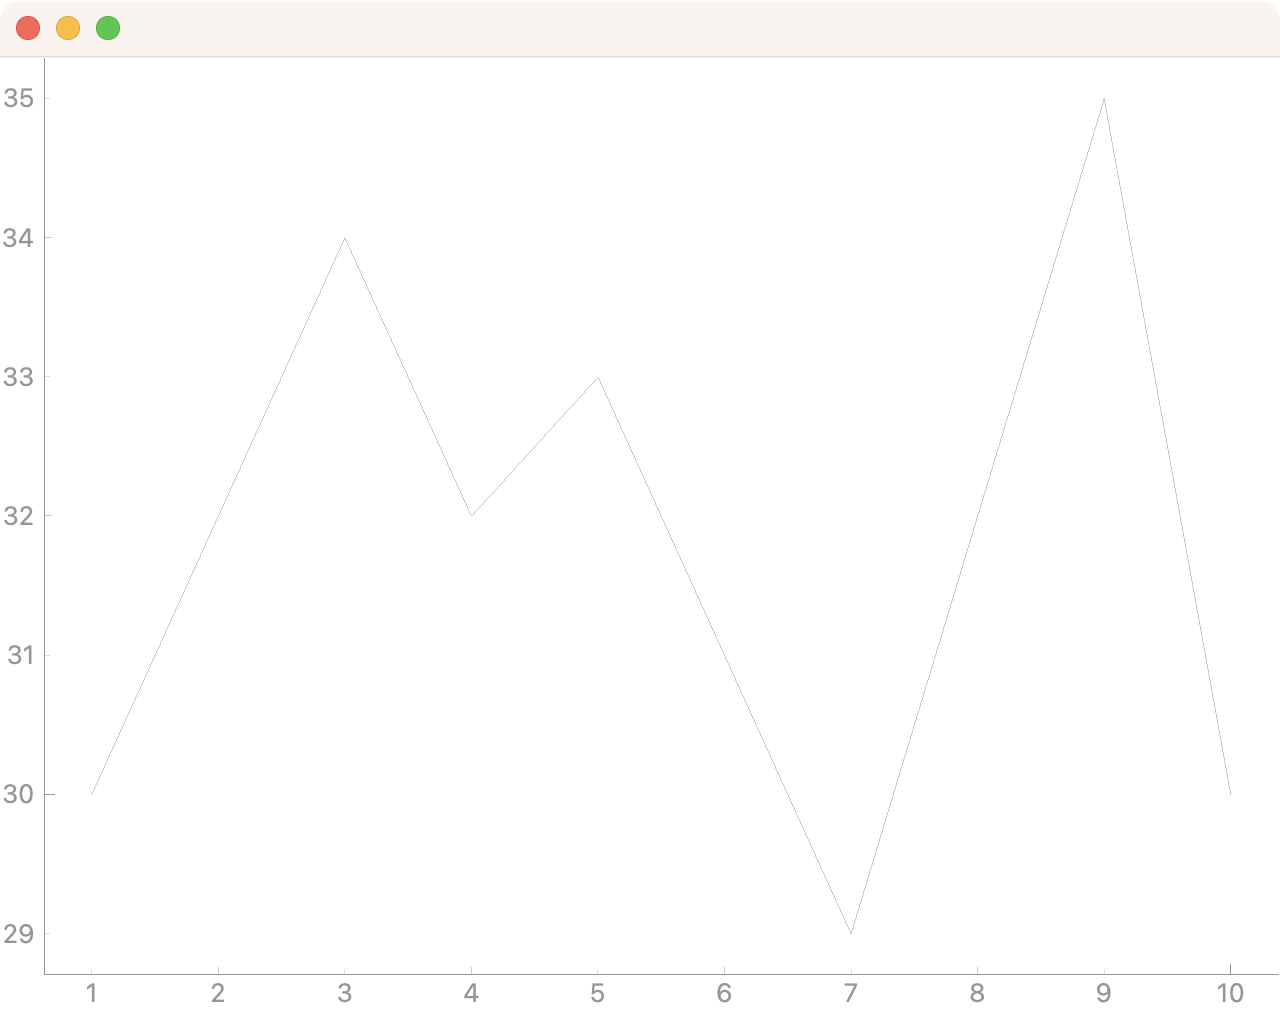
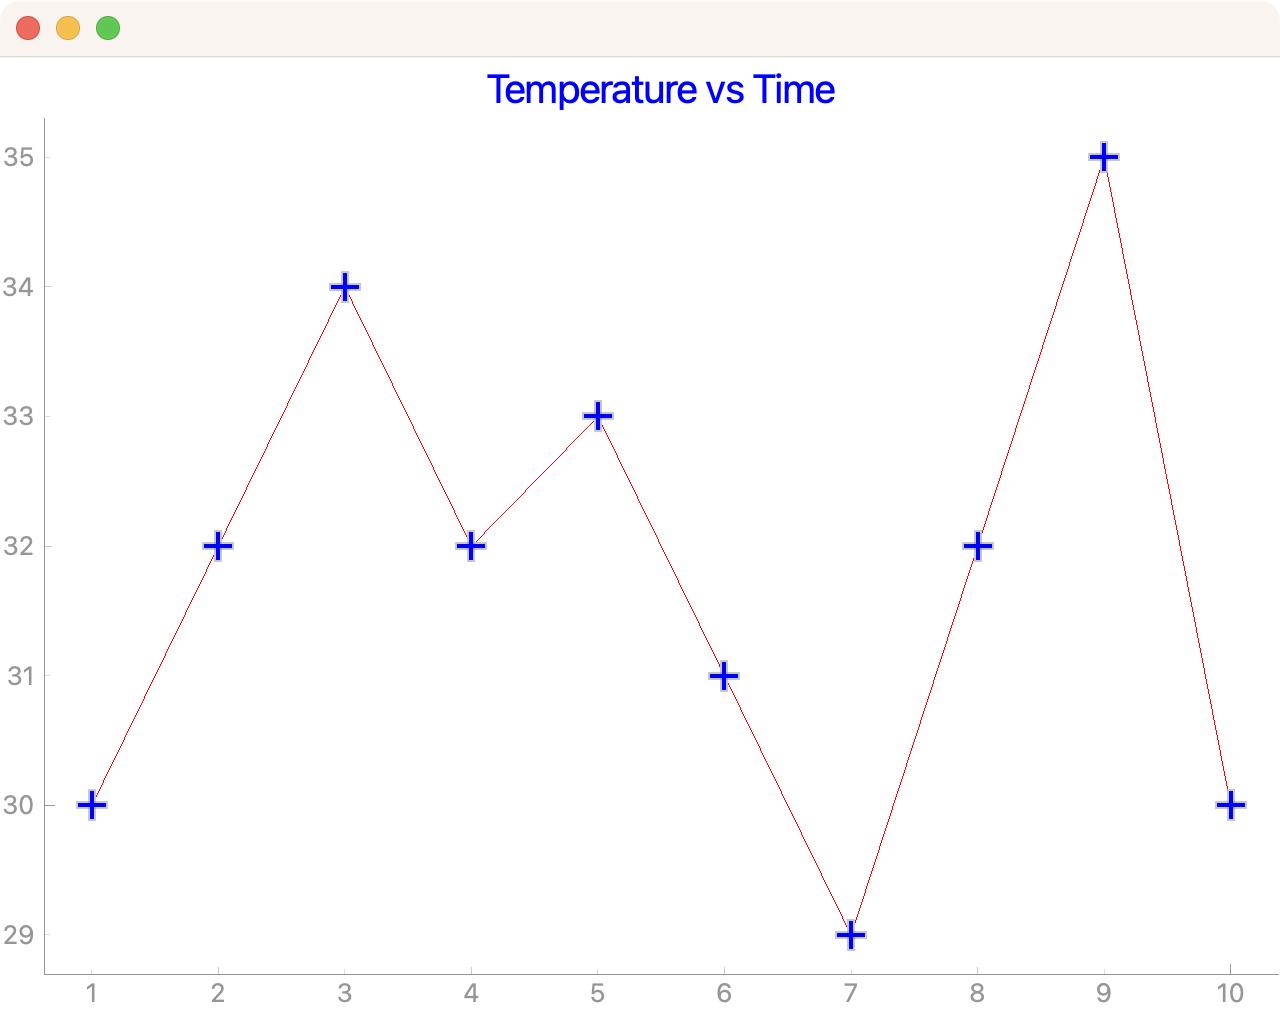
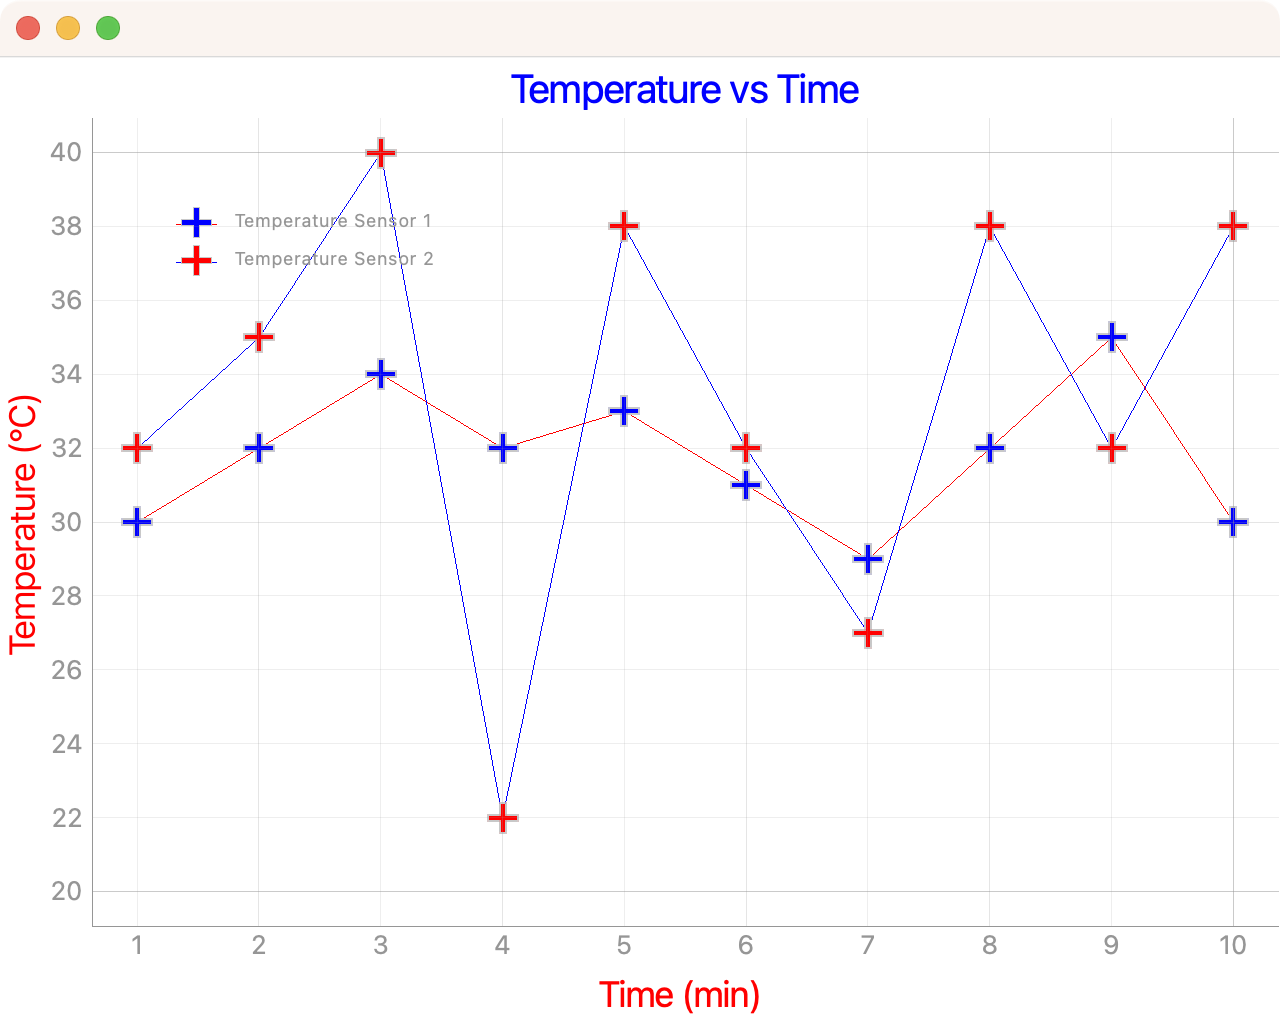
Plot lines in PyQtGraph are drawn using the Qt QPen class. This gives us full control over line drawing, as we would have in any other QGraphicsScene drawing. To use a custom pen, you need to create a new QPen instance and pass it into the plot() method.
In the app below, we use a custom QPen object to change the line color to red:
PYTHON
from PyQt5 import QtWidgets
import pyqtgraph as pg
class MainWindow(QtWidgets.QMainWindow):
def __init__(self):
super().__init__()
self.plot_graph = pg.PlotWidget()
self.setCentralWidget(self.plot_graph)
self.plot_graph.setBackground("w")
pen = pg.mkPen(color=(255, 0, 0))
time = [1, 2, 3, 4, 5, 6, 7, 8, 9, 10]
temperature = [30, 32, 34, 32, 33, 31, 29, 32, 35, 45]
self.plot_graph.plot(time, temperature, pen=pen)
app = QtWidgets.QApplication([])
main = MainWindow()
main.show()
app.exec()
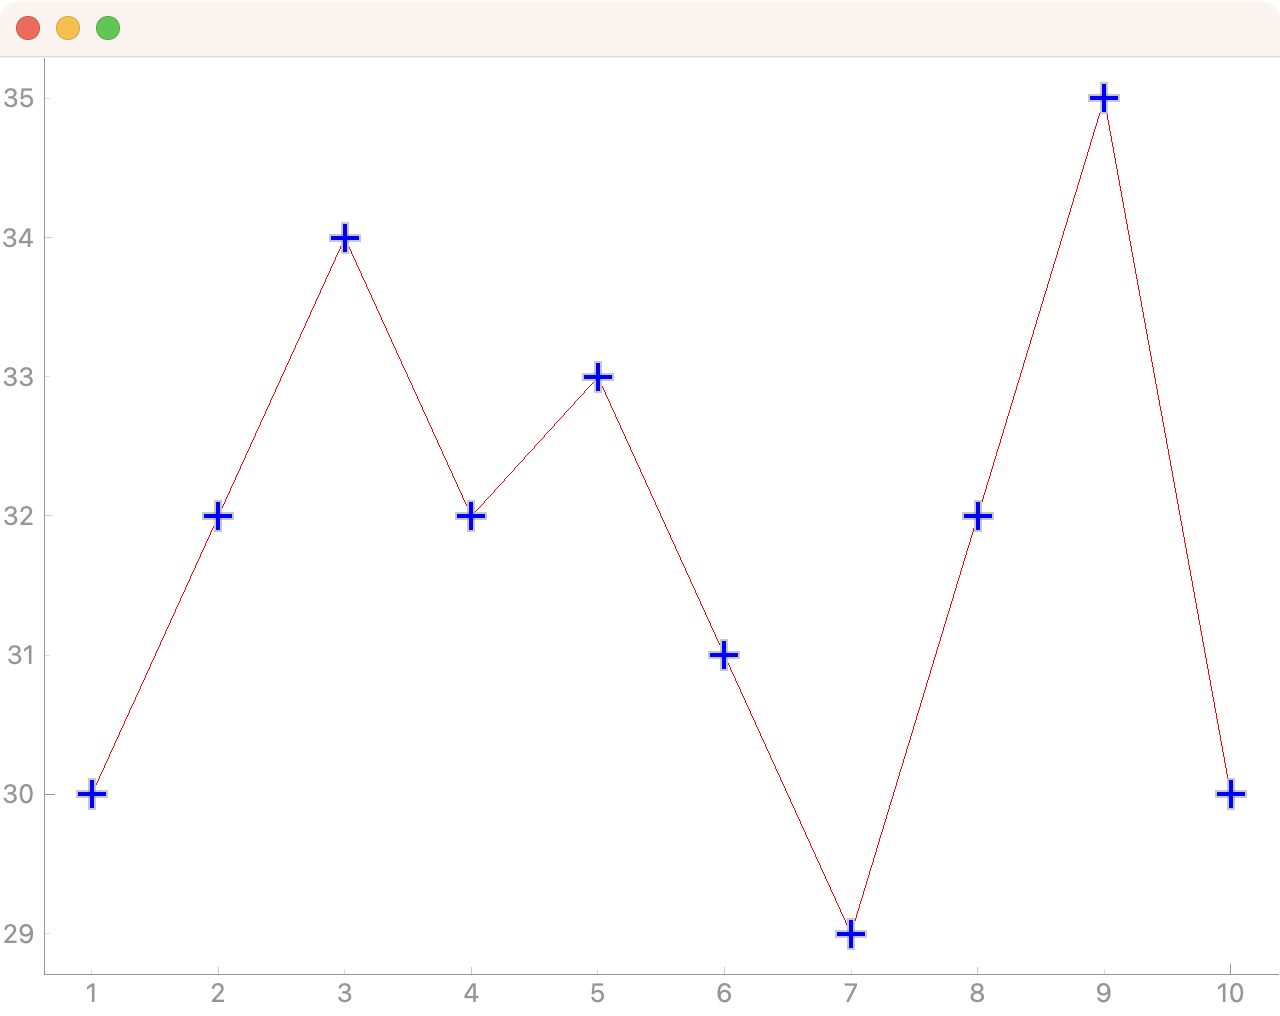
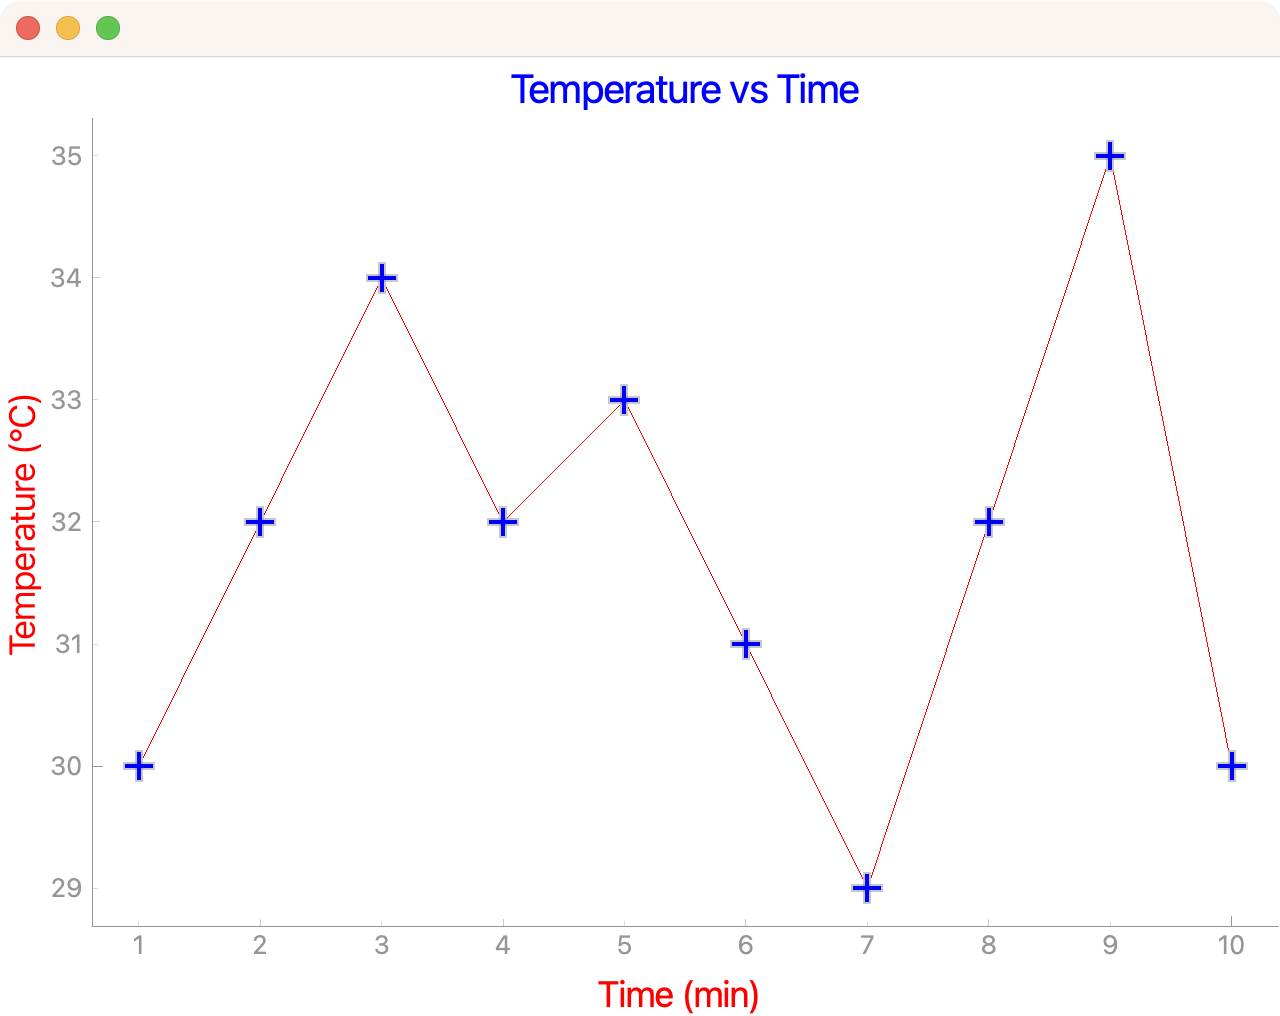
Here, we create a QPen object, passing in a 3-value tuple that defines an RGB red color. We could also define this color with the "r" code or with a QColor object. Then, we pass the pen to plot() with the pen argument.
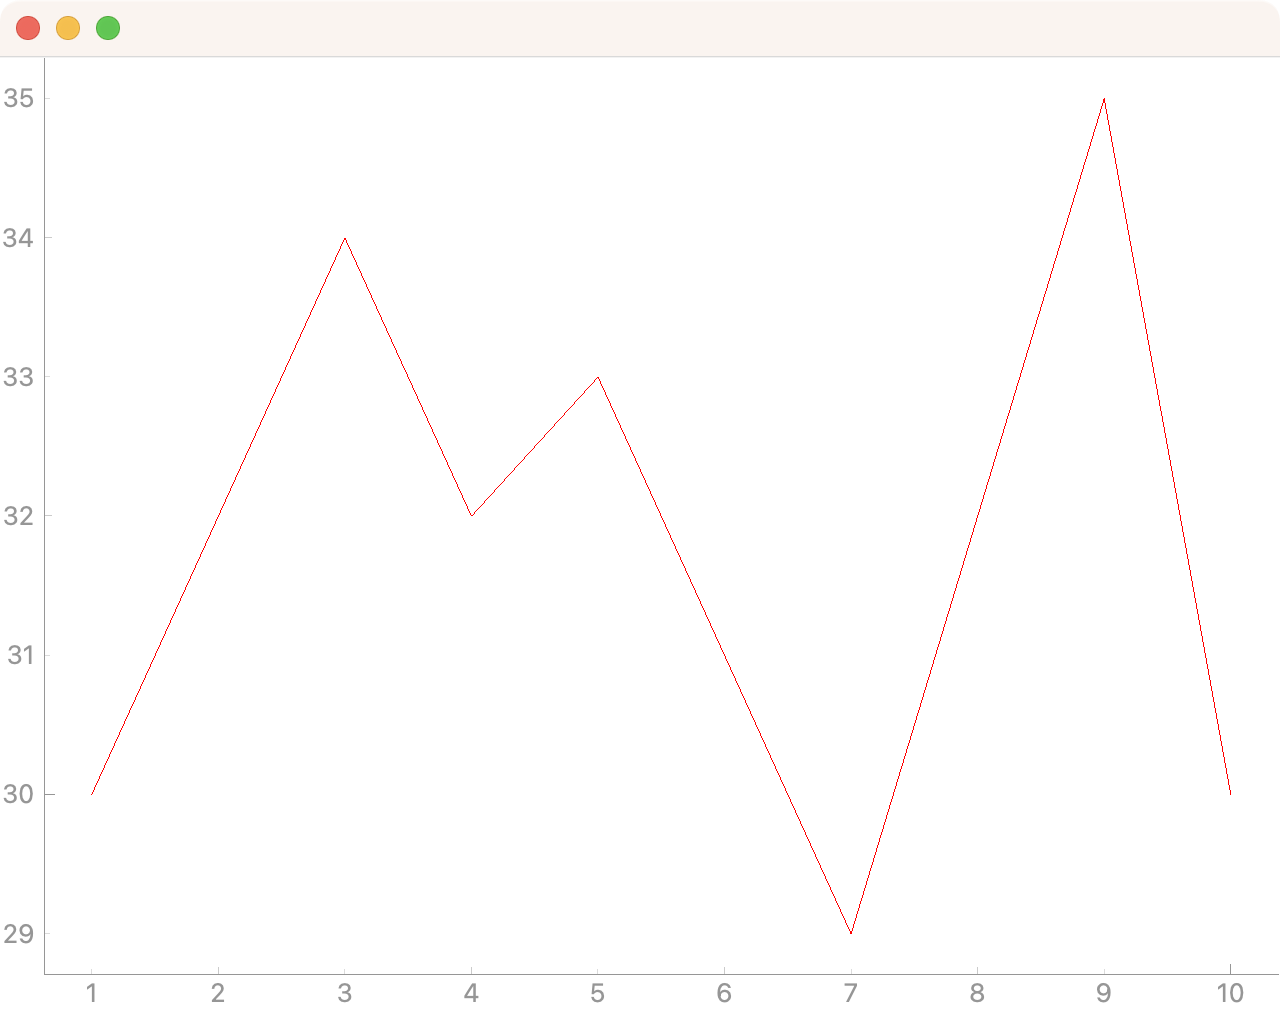 PyQtGraph plot with a red plot line.
By tweaking the QPen object, we can change the appearance of the line. For example, you can change the line width in pixels and the style (dashed, dotted, etc.), using Qt's line styles.
Update the following lines of code in your app to create a red, dashed line with 5 pixels of width:
PYTHON
from PyQt5 import QtCore, QtWidgets
pen = pg.mkPen(color=(255, 0, 0), width=5, style=QtCore.Qt.DashLine)
The result of this code is shown below, giving a 5-pixel, dashed, red line:
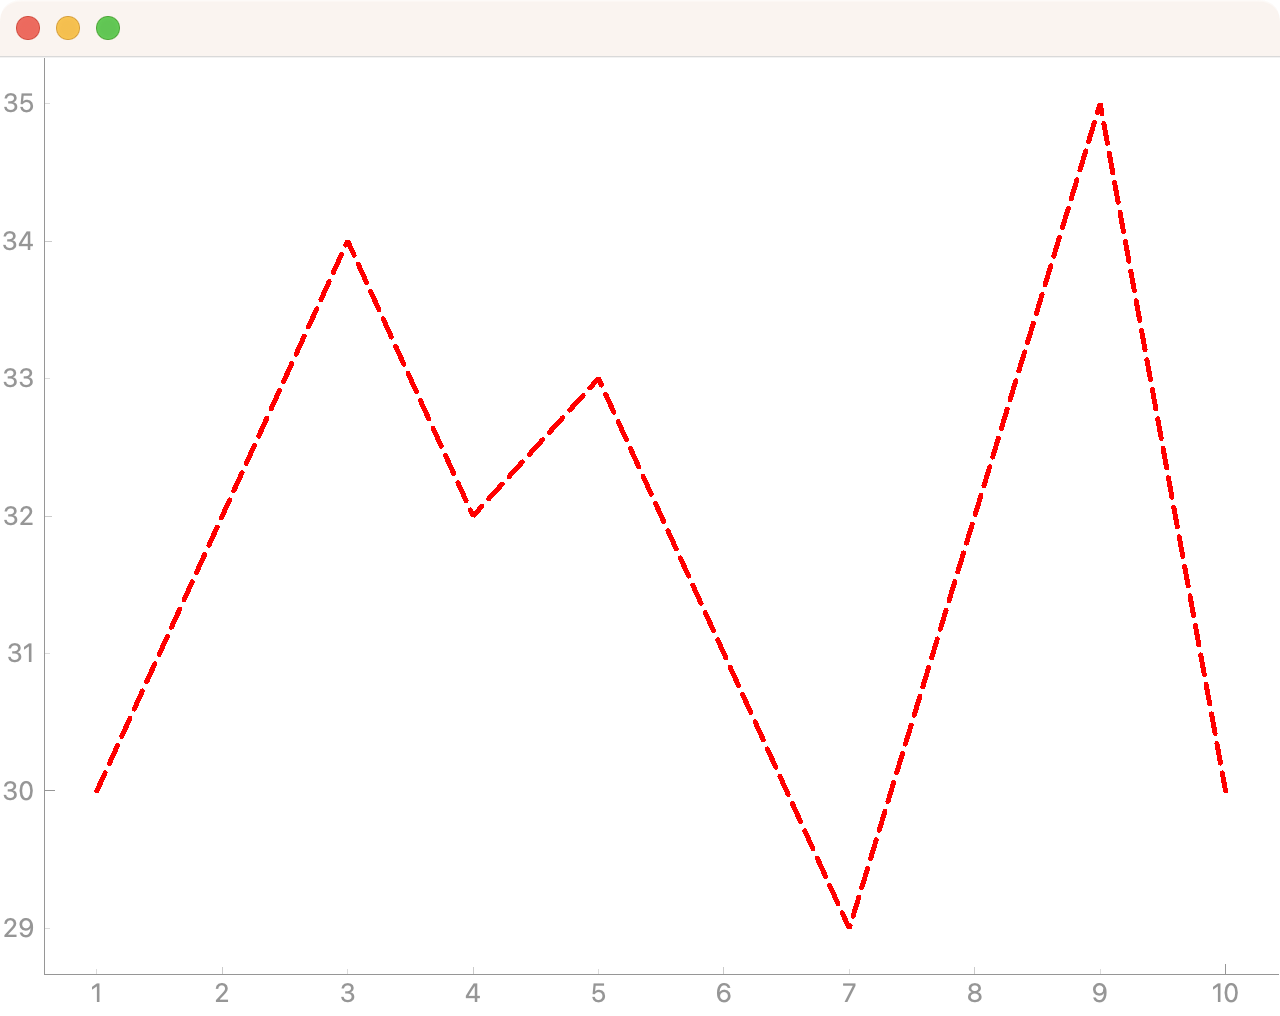 PyQtGraph plot with a red, dashed, and 5-pixel line
You can use all other Qt's line styles, including Qt.SolidLine, Qt.DotLine, Qt.DashDotLine, and Qt.DashDotDotLine. Examples of each of these lines are shown in the image below:
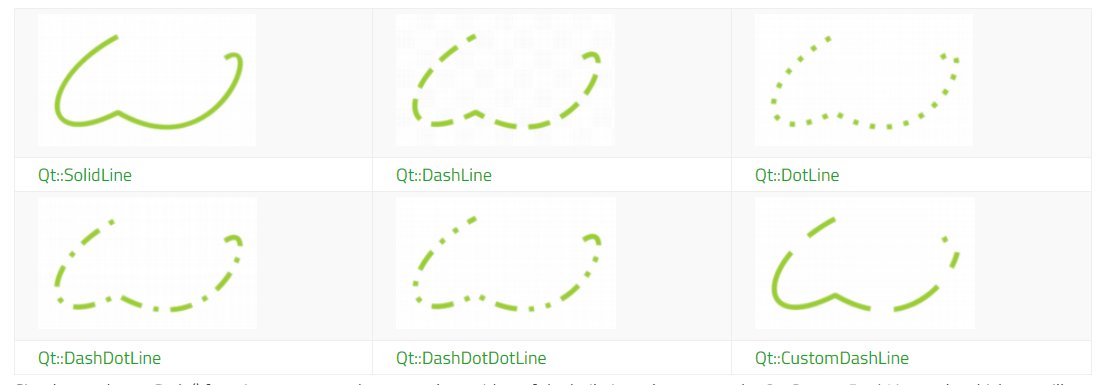 Qt's line styles.
To learn more about Qt's line styles, check the documentation about pen styles. There, you'll all you need to deeply customize the lines in your PyQtGraph plots.