
- 전체
- Python 일반
- Python 수학
- Python 그래픽
- Python 자료구조
- Python 인공지능
- Python 인터넷
- Python SAGE
- wxPython
- TkInter
- iPython
- wxPython
- pyQT
- Jython
- django
- flask
- blender python scripting
- python for minecraft
- Python 데이터 분석
- Python RPA
- cython
- PyCharm
- pySide
- kivy (python)
Python 수학 [python 수학] [PYTHON] bar 그래프에 백분율 표시하기
2024.06.06 20:36
[python 수학] [PYTHON] bar 그래프에 백분율 표시하기
0. 목표
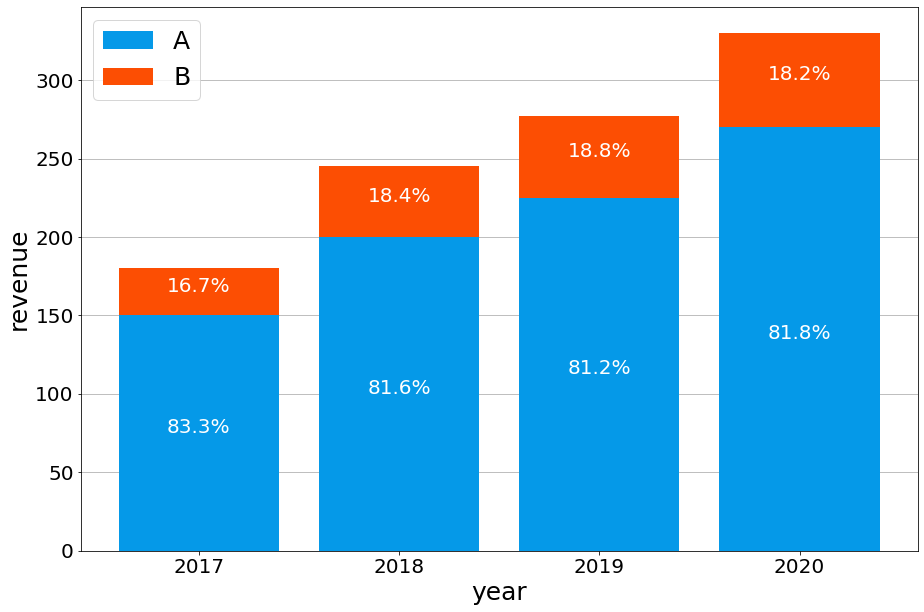
- bar 그래프에 백분율 표시하기
1. 실습
1) library 호출
import pandas as pd
import matplotlib.pyplot as plt
2) 데이터 프레임 생성
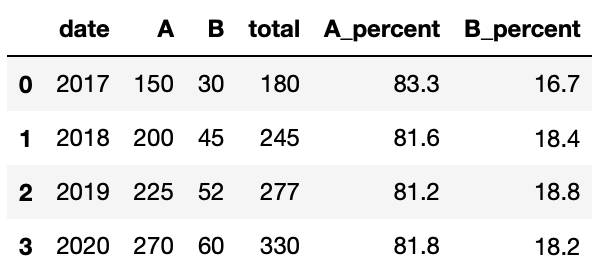
df = pd.DataFrame({'date' : ['2017', '2018', '2019', '2020'], 'A' : [150, 200, 225, 270], 'B' : [30, 45, 52, 60]})

df['total'] = df['A'] + df['B']
df['A_percent'] = round(df['A'] / df['total'] * 100, 1)
df['B_percent'] = round(100 - df['A_percent'], 1)
3) 그림 그리기
fig, ax = plt.subplots()
# 피규어 크기
fig.set_size_inches(15, 10)
# 그래프 뒤에 그리드 그리기
ax.set_axisbelow(True)
# y 축만 그리드 그리기
ax.grid(True, axis='y')
# bar 그리기
ax.bar(df['date'], df['A'], label = 'A', color = '#0599e8')
ax.bar(df['date'], df['B'], bottom = df['A'], label = 'B', color = '#fc4e03')
# 라벨 설정
ax.set_xlabel('year', fontsize = 25)
ax.set_ylabel('revenue', fontsize = 25)
# tick 설정
ax.tick_params(axis = 'x', labelsize = 20)
ax.tick_params(axis = 'y', labelsize = 20)
# 범례 표시
ax.legend(fontsize = 25)

# 텍스트 지정
for i in range(len(df['date'])):
    ax.text(df['date'][i], df['A'][i] / 2, str(df['A_percent'][i]) + '%', fontsize = 20, horizontalalignment='center', color = 'w')
    ax.text(df['date'][i], (df['A'][i] + df['A'][i] + df['B'][i])/ 2, str(df['B_percent'][i]) + '%', fontsize = 20, horizontalalignment='center', color = 'w')
- 결과
2. 참고
- Matplotlib 에서 눈금 레이블 글꼴 크기를 설정하는 방법


- [파이썬 matplotlib] 그래프 텍스트 정렬하기
- Matplotlib: draw grid lines behind other graph elements
[출처] https://pbj0812.tistory.com/470
본 웹사이트는 광고를 포함하고 있습니다.
광고 클릭에서 발생하는 수익금은 모두 웹사이트 서버의 유지 및 관리, 그리고 기술 콘텐츠 향상을 위해 쓰여집니다.
광고 클릭에서 발생하는 수익금은 모두 웹사이트 서버의 유지 및 관리, 그리고 기술 콘텐츠 향상을 위해 쓰여집니다.
댓글 0
| 번호 | 제목 | 글쓴이 | 날짜 | 조회 수 |
|---|---|---|---|---|
| 11 |
[PyQT5] PyQt5 Mainwindow에 Qt Designer를 사용한 graph Widget 추가
 | 졸리운_곰 | 2024.06.06 | 476 |
| 10 |
[PyQT5] [Python with Pyqt5] Widget에다가 그래프 넣기 (Feat. Matplotlib)
| 졸리운_곰 | 2024.06.06 | 437 |
| 9 |
[PyQT5] 파이썬(Python)PyQt5 - QMessageBox 사용하기
| 졸리운_곰 | 2024.06.06 | 455 |
| 8 |
[PyQT5] UI Designer 에서 Tab Widget 생성 하기
| 졸리운_곰 | 2024.06.06 | 420 |
| 7 |
[PyQT5] UI Designer 에서 리사이즈 시 같이 확장하기
| 졸리운_곰 | 2024.06.06 | 537 |
| 6 |
[PyQT5] UI Designer 에서 Grid Layout 배치 해보기
| 졸리운_곰 | 2024.06.06 | 474 |
| 5 |
[pyQT] 「Python : PyQt5」 Qt Designer : .ui → .py 변환
| 졸리운_곰 | 2024.06.05 | 624 |
| 4 |
[pyQT] Dev/python/ [pyqt5] 프로그램창을 항상 가장 위에 있게 하면서 동시에 타이틀 바도 없게 하려면?
| 졸리운_곰 | 2024.06.01 | 542 |
| 3 |
[pyQT] QtDesigner에서 리소스 편집기 사용하기
| 졸리운_곰 | 2024.05.28 | 499 |
| 2 |
[pyQT] Qt Resource 파일 (.qrc) 적용방법
| 졸리운_곰 | 2024.05.28 | 421 |
| 1 | [pyQT] from PyQt5.QtChart import QLineSeries, QChart, QValueAxis, QDateTimeAxis ImportError: DLL load failed while importing QtChart: 지정된 모듈을 찾을 수 없습니다. | 졸리운_곰 | 2024.01.28 | 430 |