
- 전체
- Native Apps
- WinJS App
- C# Apps
- XAML
- VB.net
- VisualC.net
- C++
- MFC
- visual studio mobile app dev
- Azure ms cloud service
- Asp.net
- 인공지능 (AI)
- wpf
- UWP
- MAUI
- asp.net
C# Apps Scientific graphics in C# - [part 2]
2018.12.06 13:42
Scientific graphics in C# - [part 2]
Scientific graphics in C# - part 2
Posted on October 9, 2011 by Sol
The code for this tutorial is on GitHub: https://github.com/sol-prog/GraphDemo2.
In the first part of this tutorial I've shown you how to plot some data on a Windows Form using C#. It is time now to improve the graphical aspect of our DemoGraph, we will start by properly formatting the numbers from the x axis, we could do this by modifying the Plot.cs class:
The above line of code will show the numbers from the x axis as two digits floating numbers:
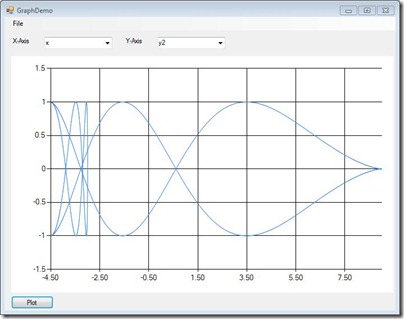
Definitely better! A further improvement will be to add names on the axes, this way when you will save a picture you will know which variable was plotted on which axis. We will use the header from the input file to get these names:
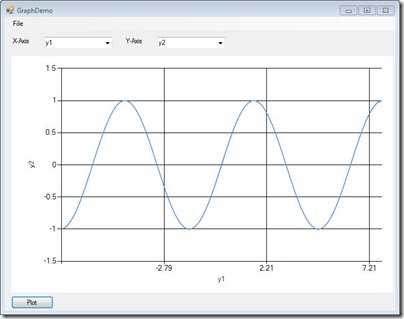
Obviously in the above picture we need to do something about the number of grid lines corresponding to the x axis, suppose we want to see six grid lines instead of three, we can achieve this by specifying the length of the grid interval and (equally important for the overall aspect) the length of the label interval:
We will also need an auxiliary function that will return the minima and maxima of data column corresponding to the x axis:


Of course a similar procedure can be applied if you need to customize the properties of the y axis. With the above code this is how our application looks:
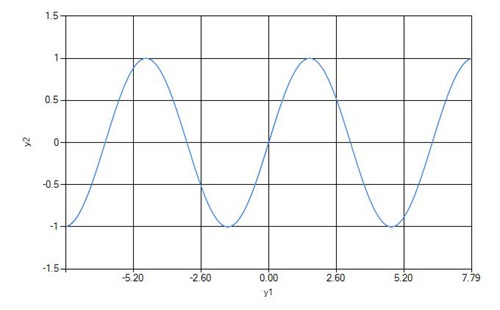
A further enhancement will be to change the format in which a picture is saved from jpg to a higher quality tiff file. Unfortunately the Chart control doesn't include the possibility to save an image as a PostScript file. However, tiff files are accepted even for journal publications, so if you need a high quality output just change jpg to tiff in the Save function.
In a real life application you won't use hard coded values for the number of grid lines of an axis, or for the color of a graph - you will add a Settings panel to your application from which the user will be able to change these parameters. This tutorial was made only for illustrative purposes so I wasn't always careful with all the little details of a robust application.
[출처] https://solarianprogrammer.com/2011/10/09/scientific-graphics-in-c-part-2/
광고 클릭에서 발생하는 수익금은 모두 웹사이트 서버의 유지 및 관리, 그리고 기술 콘텐츠 향상을 위해 쓰여집니다.
댓글 0
| 번호 | 제목 | 글쓴이 | 날짜 | 조회 수 |
|---|---|---|---|---|
| 15 | C# getMethod : Call Method by Name | 졸리운_곰 | 2017.07.01 | 258 |
| 14 | Reflection for C++ | 졸리운_곰 | 2017.07.01 | 343 |
| 13 |
Load an EXE File and Run It from Memory
 | 졸리운_곰 | 2017.07.01 | 333 |
| 12 |
.Net code injection 닷넷 코드 인젝션
| 졸리운_곰 | 2017.07.01 | 298 |
| 11 |
Three Ways to Inject Your Code into Another Process
| 졸리운_곰 | 2017.07.01 | 547 |
| 10 |
Visual C++를 사용하여 플랫폼 간 앱 제작
| 졸리운_곰 | 2015.08.16 | 645 |
| 9 |
webdav c++ lib 라이브러러
| 졸리운_곰 | 2015.05.11 | 395 |
| 8 | Use Visual Studio C++ 6.0 on Windows 8.1 64bit : 윈도우 8.1에서 비주얼 스투디오 6.0 사용하기 | 졸리운_곰 | 2015.05.09 | 632 |
| 7 |
Visual Studio 2013을 사용하여 앱 개발
| 졸리운_곰 | 2014.05.30 | 842 |
| 6 |
C++로 작성한 Windows 스토어 앱용 로드맵
| 졸리운_곰 | 2014.05.30 | 570 |
| 5 |
블로그 뷰어 앱 만들기(C++)
| 졸리운_곰 | 2014.05.30 | 3956 |
| 4 |
C++ Windows 스토어 앱에서 파일 선택기 사용(자습서 4/4)
| 졸리운_곰 | 2014.05.30 | 762 |
| 3 |
C++ Windows 스토어 앱에서 탐색 및 보기 추가(자습서 3/4)
| 졸리운_곰 | 2014.05.30 | 594 |
| 2 |
C++ Windows 스토어 앱의 수명 주기 및 상태 관리(자습서 2/4)
| 졸리운_곰 | 2014.05.30 | 496 |
| 1 |
기본 C++ Windows 스토어 앱 만들기(자습서 1/4)
| 졸리운_곰 | 2014.05.30 | 857 |