
- 전체
- Sample DB
- database modeling
- [표준 SQL] Standard SQL
- G-SQL
- 10-Min
- ORACLE
- MS SQLserver
- MySQL
- SQLite
- postgreSQL
- 데이터아키텍처전문가 - 국가공인자격
- 데이터 분석 전문가 [ADP]
- [국가공인] SQL 개발자/전문가
- NoSQL
- hadoop
- hadoop eco system
- big data (빅데이터)
- stat(통계) R 언어
- XML DB & XQuery
- spark
- DataBase Tool
- 데이터분석 & 데이터사이언스
- Engineer Quality Management
- [기계학습] machine learning
- 데이터 수집 및 전처리
- 국가기술자격 빅데이터분석기사
- 암호화폐 (비트코인, cryptocurrency, bitcoin)
stat(통계) R 언어 Reading OECD.Stat into R
2019.04.04 13:05
Reading OECD.Stat into R
OECD.Stat is a commonly used statistics portal in the research world but there are no easy ways (that I know of) to query it straight from R. There are two main benefits of querying OECD.Stat straight from R:
1. Create reproducible analysis (something that is easily lost if you have to download excel files)
2. Make tweaks to analysis easily
There are three main ways I could see to collect data from OECD.Stat
- Find the unique name for each dataset and scrape the html from the dataset’s landing page (e.g. the unique URL for pension operating expenses is http://stats.oecd.org/Index.aspx?DataSetCode=PNNI_NEW). This probably would have been the easiest way to scrape the data but it doesn’t offer the flexibility that the other two options do.
- Use the OECD Open Data API . This was the avenue I explored initially but it doesn’t seem that the API functionality is fully built yet.
- Use the SDMX query provided under the export tab on the OECD.Stat site. This URL query can be easily edited to change the selected countries, observation range and even datasets.
I went with option 3, using the SDMX query.
To get the query that you need to use in R, navigate to your dataset and click
export -> SDMX (XML) (as per picture below)

Then, copy everything in the ‘SDMX DATA URL’ box
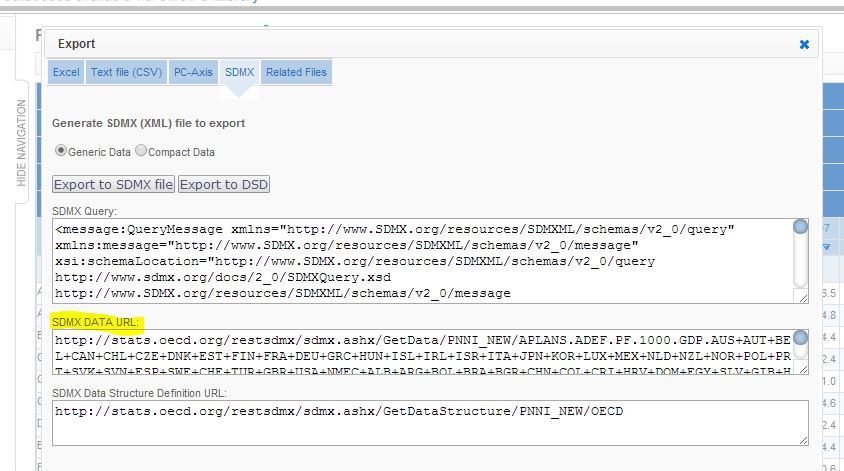
In the example below I am using the trade union density dataset.
Getting the SDMX URL as described above for the trade union dataset gives us a very long URL as it contains a lot countries. I cut it down in this example for clarity to:


The important parts of the URL above are
- UN_DEN – This is the Trade Union Density dataset code
- AUS+CAN+FRA+DEU+NZL+GBR+USA+OECD – Unsurprisingly, this is the list of countries we are querying, you can delete countries or if you know the ISO country codes you can add to it.
- startTime=1960&endTime=2012 – Change the date range as you please.
Note that many datasets have a lot more options on offer so there is usually a bunch more junk after the dataset code in the URL.
The following code R code creates a melted data frame, ready for use in analysis or ggplot or rCharts. I make use of Carson Sievert’s XML2R package. All you need to do is paste your own SDMX URL into the relevant spot.
|
1
2
3
4
5
6
7
8
9
10
11
12
13
14
15
16
17
18
19
20
21
22
23
24
25
26
27
28
29
30
31
32
|
library(XML2R)file <- "http://stats.oecd.org/restsdmx/sdmx.ashx/GetData/UN_DEN/AUS+CAN+FRA+DEU+NZL+GBR+USA+OECD/OECD?startTime=1960&endTime=2012"obs <- XML2Obs(file)tables <- collapse_obs(obs)# The data we care about is stored in the following three nodes# We only care about the country variable in the keys nodekeys <- tables[["MessageGroup//DataSet//Series//SeriesKey//Value"]]dates <- tables[["MessageGroup//DataSet//Series//Obs//Time"]]values <- tables[["MessageGroup//DataSet//Series//Obs//ObsValue"]]# Extract the country part of the keys table# Have to use both COU and COUNTRY as OECD don't use a standard namecountry_list <- keys[keys[,1]== "COU" | keys[,1]== "COUNTRY"]# The country names are stored in the middle third of the above listcountry_list <- country_list[(length(country_list)*1/3+1):(length(country_list)*2/3)]# Bind the existing date and value vectorsdat <- cbind.data.frame(as.numeric(dates[,1]),as.numeric(values[,1]))colnames(dat) <- c('date', 'value')# Add the country variable# This code maps a new country each time the diff(dat$date)<=0 ...# ...as there are a different number of readings for each country# This is not particularly robustdat$country <- c(country_list[1], country_list[cumsum(diff(dat$date) <= 0) + 1])#created this as too many sig figs make the rChart uglydat$value2 <- signif(dat$value,2)head(dat) |
This should create a data frame for nearly all annualised OECD.Stat data. You will need to do some work with the dates if you want to use more frequently reported data (e.g. quarterly, monthly data).
Once the data is set up like this it is very easy to visualise.
|
1
2
|
library(ggplot2)ggplot(dat) + geom_line(aes(date,value,colour=country)) |
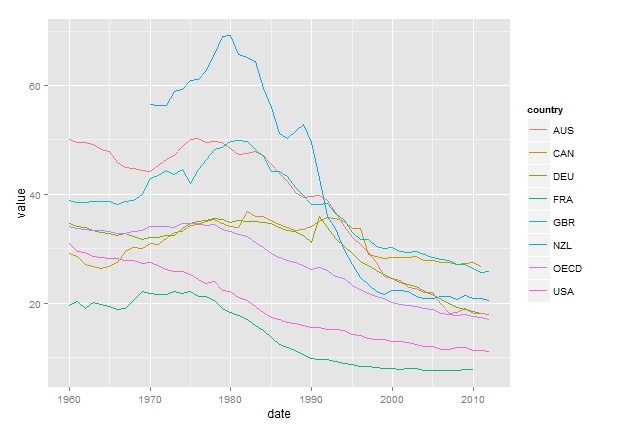
Or just as easy but a bit cooler, use rCharts to make it interactive
|
1
2
3
4
5
6
7
8
9
10
|
# library(devtools)# install_github('rCharts', 'ramnathv', ref = 'dev')library(rCharts)n1 <- nPlot(value2 ~ date, group = "country", data = dat, type = "lineChart")n1$chart(forceY = c(0))#To publish to a gist on github use this code, it will produce the url for viewing#(you need a github account)n1$publish('Union Density over time', host = 'gist') |
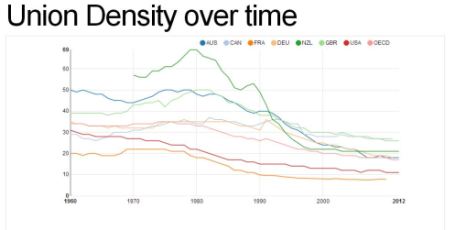
Link to the interactive is here (or click on the image below)
 [출처]
[출처] 광고 클릭에서 발생하는 수익금은 모두 웹사이트 서버의 유지 및 관리, 그리고 기술 콘텐츠 향상을 위해 쓰여집니다.
