
- 전체
- HTML
- Web Design (웹디자인)
- XE 응용 개발
- wordpress plugin dev
- Javascript & JavaScript Application
- MEAN Stack : full stack javascript
- angular js & ionic framework
- bootstrap
- WebGL, Three.js and Babylon.js
- restful api design
- mobile web
- node.js 응용
- Cloud Service 응용
- 웹 어셈블리 개발 [WASM, WebAssembly]
- 마이크로서비스, MSA (microservice architecture)
- WebGL / WebGPU
- next.js 개발
- micro frontend (마이크로프론트앤드)
- 전자상거래/쇼핑몰
- 서버 클라우드 (aws, azure, google)
HTML5 SVG by HTML5
2015.11.12 13:01
SVG by HTML5
Getting Started With SVG
| Written by Ian Elliot | ||||||||
Page 1 of 2
Although Canvas is the star graphic component of HTML5, we shouldn't forget SVG, which provides vector graphics using tags and script. We take a programmer's look at how it all works. Although the canvas element and object was the big news in HTML5, an old friend in the form of SVG has also joined the ranks of the new technologies. SVG has been around for some time but it never managed to gain enough support to become a de facto standard. Most browsers with the exception of IE support SVG before the HTML5 standard. Now IE9 and later support it. So it is fairly safe to use SVG alongside canvas. But wait! Why two graphics objects? Isn't one enough? The simple answer is that there are two distinct types of graphics that you can create - bitmap and vector. There has been confusion over different types of graphics formats for as long as there have been graphics applications and the web is no exception. Until recently nearly all the graphics you would find in a web page were bitmap graphics - jpeg, png and gif format images are all bitmaps. A bitmap is essentially just a file containing a list of color values for each pixel in the image. Generating a bitmap image is just a matter of writing a program that sets pixels to specific colors. In bitmap everything is a pixel. What is a vector format?Well the simple answer is that a vector format is a program that draws a bitmap. For example if you want to display a circle in a web page then the simple and most direct way of doing it is to insert a picture of a circle in .GIF or JPG format – i.e. a bitmap of a circle. An alternative way of doing the same job is to write a program that draws a circle, i.e. setting the pixels required, when the web page is loaded and this would be referred to as a vector format. The advantage of the vector format is that the program that draws the circle is a lot smaller than the file of pixels it generates. Also as the circle is drawn each time is is needed it can use whatever bitmap resolution is available - this is often expressed as vector drawings are resolution independent or they can scale. The disadvantage of vector drawing is that it takes processor time and this can be significant for a complex graphic. There is also the small matter of creativity. Bitmaps can be "painted" using brushes that modify the color of the pixels they pass over. With a bitmap you paint areas. A vector drawing on the other hand you draw geometric outlines and then use fill tools or operators to achieve blocks of color. Vector drawing is more like technical drawing but don't underestimate it for creative work - it can produce amazing results. Vector formatsThere are two relatively vector formats for the web – SVG and VML. VML was MIcrosoft's preferred way of doing web vector drawing and it is what Explorer supported until version 9. With the renewed adoption of SVG as a standard you can mostly forget VML in a general setting but you need to know that earlier versions of IE don't work with SVG unless you load an add-in from Adobe’s web site - www.adobe.com/svg. For other browsers even older versions don't need an add-in to run SVG. All modern browsers support SVG out of the box. There is another difference between canvas and SVG that it is worth being clear about. SVG has lots of HTML tags that allow you to create static and animated graphics. SVG objects are also exposed in the DOM allowing you to write scripts that draw vector graphics on an SVG surface. So with SVG you have a choice of HTML or JavaScript to create and/or manipulate the graphic. There are also SVG editors and general drawing programs - InkScape for example - that will let you draw using standard tools and output the result as an SVG file. Canvas on the other hand is very much a scripting object and you draw on a canvas object using JavaScript. In this article we look at how to work with SVG using HMTL tags and in a future article we will look at scripting SVG. So what is SVG?Think of it as a programming language for graphics and you won’t be far wrong but this does ignore the small detail that it is based on XML. As long as you can ignore many of the details that are necessary to conform to the way XML works you can simply think of SVG as a graphics language. To get started use NotePad or some other ASCII text editor to create the following file:
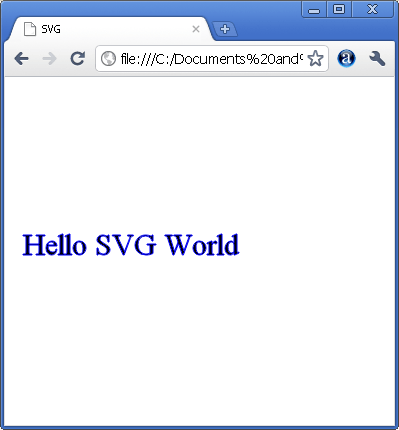
Save this as hello.html and load it into Chrome or whatever SVG equipped browser you are using. The result should be a fairly boring text message but this is the start of more interesting things.
Hello SVG
The program is fairly simple if you ignore the usual preamble. Concentrate on the content starting <svg. This tag starts the SVG image area and you can see how to specify its size, you can also add an x and y co-ordinate to specify the top left-hand corner. SVG tagsAll of the SVG tags that actually write on the image area occur between the <svg> and closing tag </svg>. In this example, only a single pair of tags occur and you can see how these work to position and determine the way the text looks. If you want to add a real graphics component to the program try the tag:
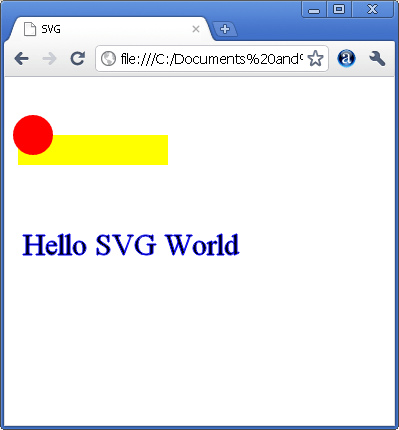
This draws a yellow filled rectangle at 5,50. The only really new feature here is the use of the "style" to set the fill colour. You can use additional parameters to set outline colour, width and pattern for example. There are other shape elements like that you can use and they all follow the same general format. For example, to draw a circle simply add:
Notice that what is drawn on top of what, without going into much more complexity, is simply controlled by the drawing order.
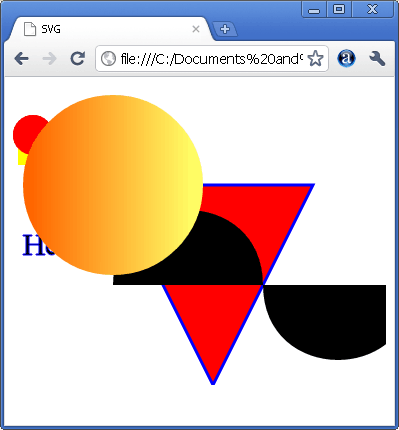
A Mondrian like creation – the painter not the language!
The complete list of predefined shapes is:
and it is fairly easy to define new tags for custom shapes and group instructions together.
Getting Started With SVG
|


광고 클릭에서 발생하는 수익금은 모두 웹사이트 서버의 유지 및 관리, 그리고 기술 콘텐츠 향상을 위해 쓰여집니다.
