
- 전체
- HTML
- Web Design (웹디자인)
- XE 응용 개발
- wordpress plugin dev
- Javascript & JavaScript Application
- MEAN Stack : full stack javascript
- angular js & ionic framework
- bootstrap
- WebGL, Three.js and Babylon.js
- restful api design
- mobile web
- node.js 응용
- Cloud Service 응용
- 웹 어셈블리 개발 [WASM, WebAssembly]
- 마이크로서비스, MSA (microservice architecture)
- WebGL / WebGPU
- next.js 개발
- micro frontend (마이크로프론트앤드)
- 전자상거래/쇼핑몰
- 서버 클라우드 (aws, azure, google)
Monitor Rendering Performance Within Three.js
Posted by Alexandra Etienne and Jerome EtienneThis post is about monitoring rendering performance within three.js. It presents a small standalone extension called threex.rendererstats. It collect information from three.js renderer and display it live. It is very usefull to diagnose performance issues while developping. The API is exactly the same as stats.js so it is easy for you to include in your own stuff.
What Is It ?
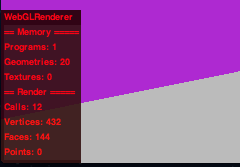
threex.rendererstats collects information about three.js renderer and display it realtime on your screen. It is released under MIT license and is available on github. See a screenshot on the right.
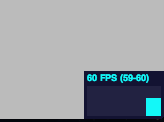
It is inpired from stats.js by mrdoob. See a screenshot on the left. Webgl renderer keeps some internal statistics on the scene being renderered and update it at every frame. It is accessible in a property .info. threex.rendererstats just gather this information and display it nicely on your screen.
How Is It Useful ?
It is a very nice tool to monitor performances of WebGL rendering. As it is updated realtime, you can identify performance issues at various moments within your game We have seen canvas inspection recently in Debugging With Chrome’s Canvas Inspection. canvas inspection is directly at webgl level. threex.rendererstats remains at three.js level to give you another kind of information on the renderer.
Lets details those information There is 2 sections one for the memory, another for the renderer. For the memory, you got
info.memory.geometry: number of geometry currently in memoryinfo.memory.programs: number of shaders currently in memoryinfo.memory.texture: number of texture currently in memory
For the render, you got


info.render.calls: number of draw calls currently used to renderinfo.render.vertices: number of vertices currently renderedinfo.render.faces: number of triangles currently rendereredinfo.render.points: number of particles currently rendered
How To Use It ?
first, include threex.rendererstats.js with the usual <script> tag.
1 |
|
then you initialize the object.
1 |
|
You likely need to position it on the page with css. You may use something along this line
1 2 3 4 |
|
finally you update it at every frame in your rendering loop or when you do renderer.render()
1 |
|
And you are done. Quite easy to include! Now you can monitor your own three.js scenes.
Conclusion
We have seen how to monitor performance information withing three.js. How to display and use the statistics collected by THREE.WebGLRenderer itself. The information may appear a bit raw but it is live. So unexpected performance changes can be detected very early.
That’s all for today! have fun :)
stats.js-master.zip
threex.rendererstats-master.zip
[출처] http://learningthreejs.com/blog/2013/06/25/monitor-rendering-performance-within-threejs/
광고 클릭에서 발생하는 수익금은 모두 웹사이트 서버의 유지 및 관리, 그리고 기술 콘텐츠 향상을 위해 쓰여집니다.
댓글 0
| 번호 | 제목 | 글쓴이 | 날짜 | 조회 수 |
|---|---|---|---|---|
| 1 |
jQuery Mobile Form Example
 | 졸리운_곰 | 2018.09.04 | 428 |