
- 전체
- Sample DB
- database modeling
- [표준 SQL] Standard SQL
- G-SQL
- 10-Min
- ORACLE
- MS SQLserver
- MySQL
- SQLite
- postgreSQL
- 데이터아키텍처전문가 - 국가공인자격
- 데이터 분석 전문가 [ADP]
- [국가공인] SQL 개발자/전문가
- NoSQL
- hadoop
- hadoop eco system
- big data (빅데이터)
- stat(통계) R 언어
- XML DB & XQuery
- spark
- DataBase Tool
- 데이터분석 & 데이터사이언스
- Engineer Quality Management
- [기계학습] machine learning
- 데이터 수집 및 전처리
- 국가기술자격 빅데이터분석기사
- 암호화폐 (비트코인, cryptocurrency, bitcoin)
데이터분석 & 데이터사이언스 [데이터분석][머신러닝] When not to use machine learning or AI Adventures in wishful thinking, nonstationarity, and pattern-finding / 기계 학습 또는 AI를 사용하지 않아야하는 경우 희망찬 사고, 비정상 성, 패턴 찾기의 모험
2021.03.28 17:42
[데이터분석][머신러닝] When not to use machine learning or AI Adventures in wishful thinking, nonstationarity, and pattern-finding /
기계 학습 또는 AI를 사용하지 않아야하는 경우 희망찬 사고, 비정상 성, 패턴 찾기의 모험
Imagine that you’ve just managed to get your hands on a dataset from a clinical trial. Exciting! To help you get in character, I made up some data for you to look at:


Pretend that these datapoints map out the relationship between the treatment day (input “feature”) and the correct dosage of some miracle cure in milligrams (output “prediction”) that a patient should receive for over the course of 60 days.
#The data:
(1,28)  (2,17)  (3,92)  (4,41)  (5,9)   (6,87)  (7,54) (8,3)   (9,78)  (10,67) (11,1)  (12,67) (13,78) (14,3) (15,55) (16,86) (17,8)  (18,42) (19,92) (20,17) (21,29) (22,94) (23,28) (24,18) (25,93) (26,40) (27,9)  (28,87) (29,53) (30,3)  (31,79) (32,66) (33,1)  (34,68) (35,77) (36,3)  (37,56) (38,86) (39,8)  (40,43) (41,92) (42,16) (43,30) (44,94) (45,27) (46,19) (47,93) (48,39) (49,10) (50,88) (51,53) (52,4)  (53,80) (54,65) (55,1)  (56,69) (57,77) (58,3)  (59,57) (60,86) ...
Now imagine that you’re treating a patient and it’s day 2. What dose do you suggest we use?

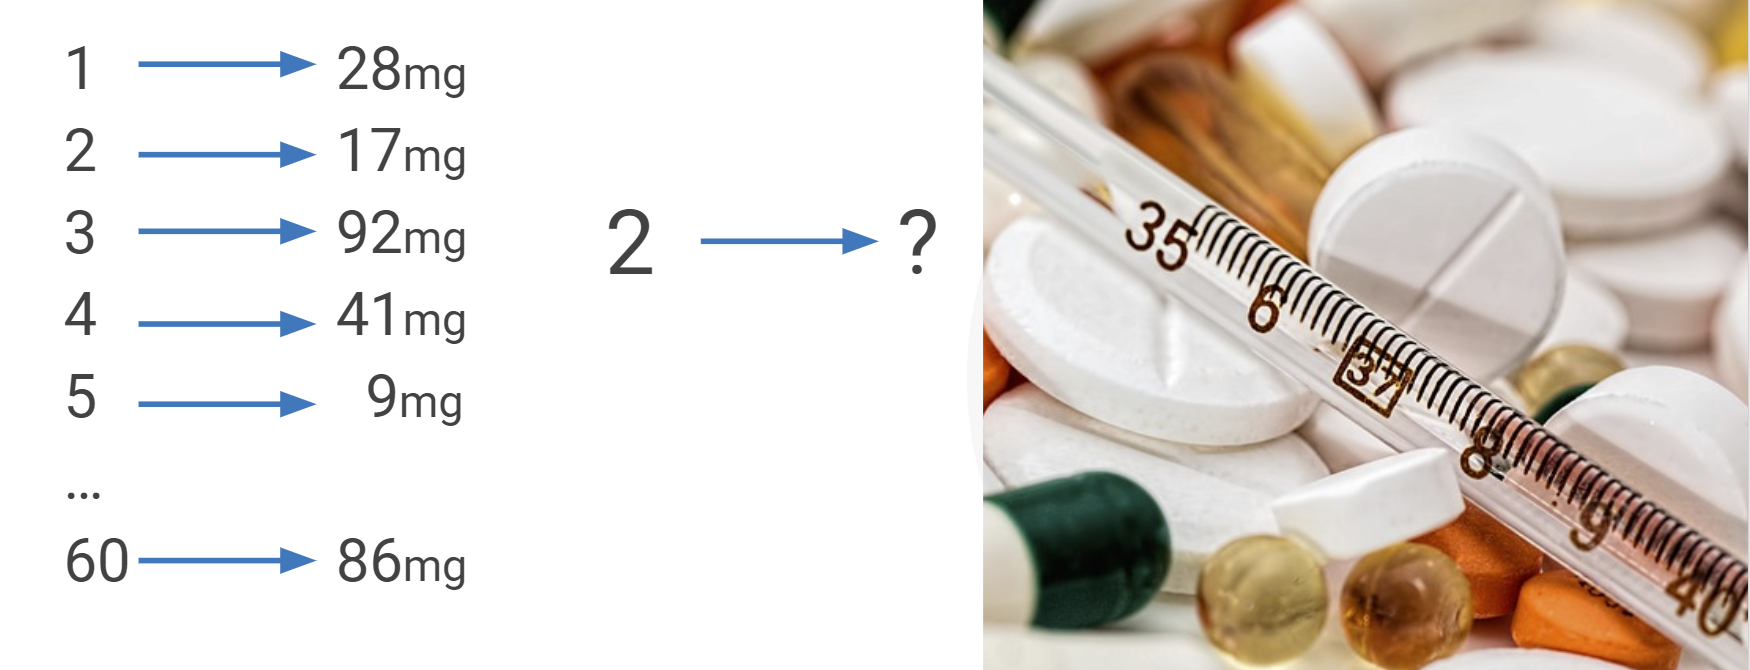
I really hope you answered “17mg” since this was definitely not supposed to be a trick question. How about day 4? 41mg? Yes indeedy!
Now, how would you build software to output the right doses on days 1–5? Would you try to use machine learning (ML)? In other words, would you try to find patterns in these data and try to turn them into a recipe (“model”) for going from inputs to outputs?
No, of course you wouldn’t! You’d get your software to do exactly what you’re doing: look the answer up in a table. That way, you’ll get the right answer 100% of the time for all 60 days. No need for patterns here and no need for machine learning either.
So, what sort of situation requires machine learning?

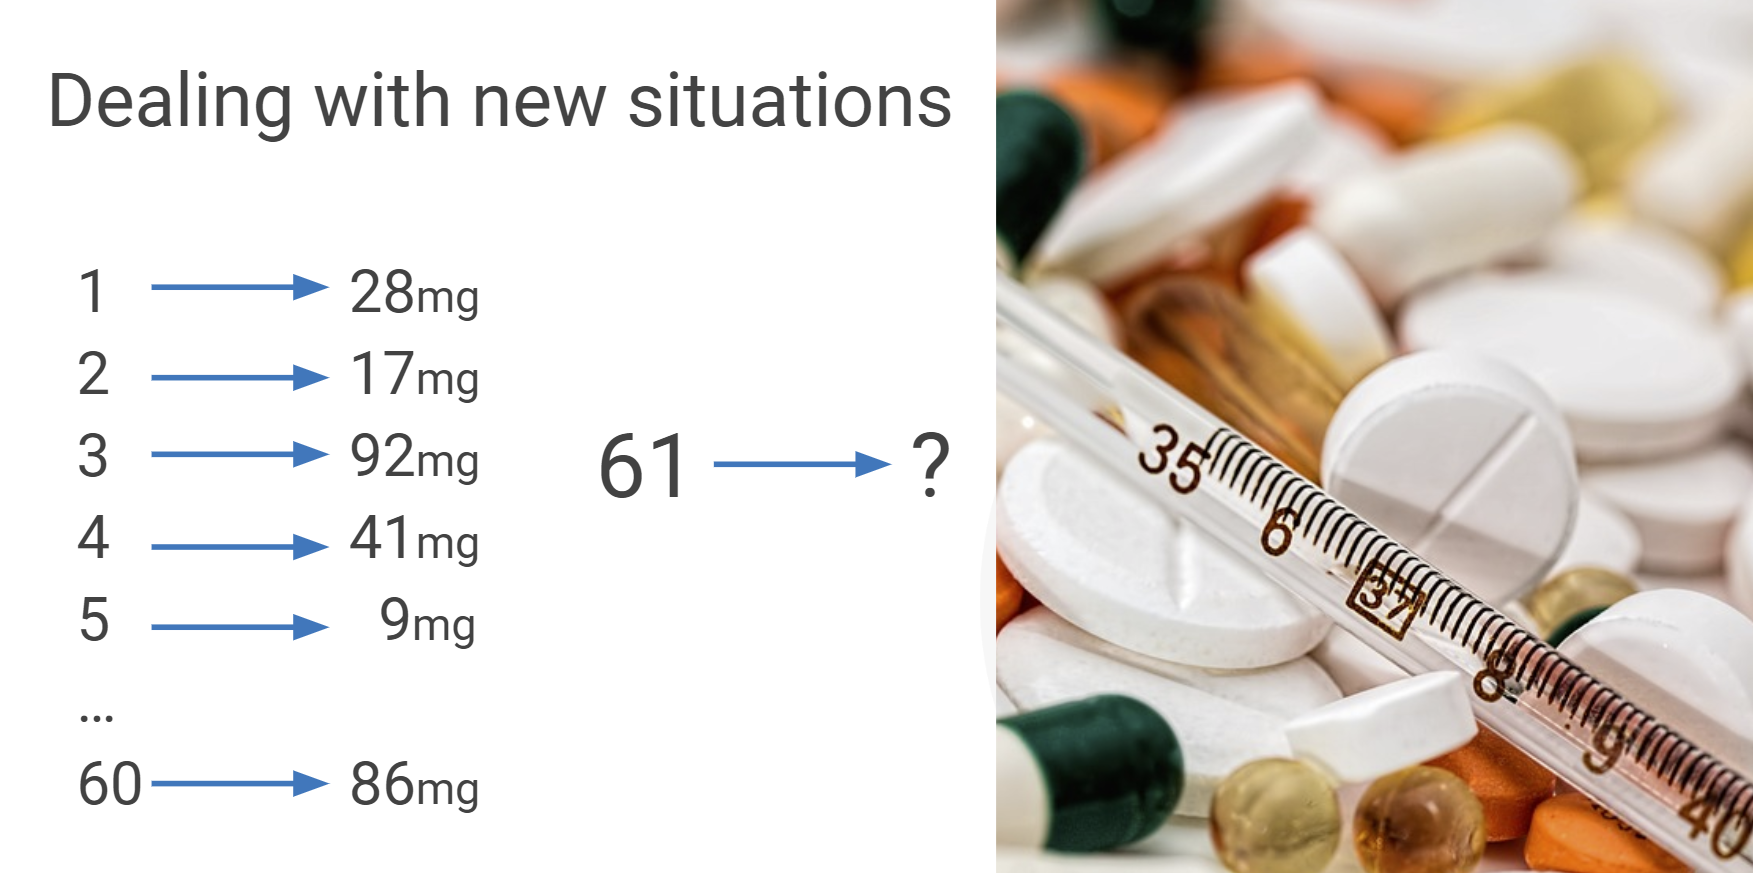
How about now? It’s day 61. What’s the right answer here?
Well, we’ve never seen data for day 61, so there’s no way we can look up the answer here. What can we do? Are we out of luck? Can machine learning help us?
That depends.
If there’s no pattern that connects the inputs with the outputs, forget it. In that case, nothing can help us… short of actual magic, which doesn’t exist (in case you thought machine learning was it). Give up now!
We must find a useful pattern
But if there is a pattern and if (that’s a big if!) we could find it, then we could try to apply it to day 61 to try to predict/guess the right answer. Perhaps machine learning might help us.
The pattern must generalize
The trouble is that it’s not enough for there to be a pattern in our data. That would be much too convenient. The pattern also has to be relevant beyond day 60. What if the conditions are fundamentally different in day 61, so the pattern doesn’t generalize? For all you know, maybe on day 61 all patients are fully cured or dead or on an incompatible medication. Then the pattern is no good to you.
Nonstationary universes
Let this sink in. If your data aren’t a useful window into tomorrow’s world — perhaps because a pandemic changed all the rules — it doesn’t matter how good your information was yesterday. If you live in an unstable corner of the universe, you’ll have a hard time justifying what we call ergodicity and stationarity assumptions. These roughly translate to “I believe that the rules haven’t changed.”
I’m not talking about the kind of nonstationarity that’s in the eye of the beholder (like when average prices appear to drift over time because you forgot to adjust for inflation). Dealing with gentle nonstationarity (when the rules are a predictable function of time) is what the field of time series analysis is all about.
I’m talking about the kind of violent nonstationarity that you can’t do anything about because your system’s rules are fundamentally different in a way you can’t predict from one period to the next. If your past data suddenly don’t apply at all to your nonstationary future, you’re not allowed to use yesterday to predict tomorrow with a straight face.


Maybe you’re in luck
But if there is a pattern and if this pattern is relevant to the new situation we find ourselves in, then we’re in business. We could go and find the pattern in the old data, make a recipe based on it, and then use that recipe to succeed on day 61 and beyond!
Finding patterns and using them is what machine learning is all about.
When to use machine learning
In applied machine learning (and AI), you’re not in the business of regurgitating memorized examples you’ve seen before — you don’t need ML for that, just look ’em up! —you’re here to learn.
Just repeat old answers? ML can do better! It succeeds on new examples.
Your mission? To build a solution that generalizes successfully (or pull the plug on your project). (What does “successfully” mean? I have a whole guide for you on that topic.)


In other words, your solution is no good if it can’t handle new examples it has never seen before. Not dramatically new examples that break all the rules of a stationary universe, but slight twists on the learned theme.
We’re not here to memorize like a parrot. We’re here to generalize to new situations. That’s the power and the beauty of machine learning.
If you haven’t seen this exact combination of input values before (day 61), what’s the right output answer? Well, maybe we can turn old patterns into a recipe that makes a decent guess.
For example, if you trained a cat/not-cat classifier from thousands of animal photos, you can ask it to tell you if a brand new photo has a cat in it, but you shouldn’t ask it to tell you whether a painting is in the Cubist style.
Is machine learning for you?
If you’re sick of hearing me call it a thing-labeler and an alternative approach to writing code, let me try putting it another way.
Machine learning is an approach to automating repeated decisions that involves algorithmically finding patterns in data and using these to make recipes that deal correctly with brand new data.
To know if machine learning is for you, I have three guides you might enjoy:
- Is your ML/AI project a nonstarter? A 22-item reality check(list)
- Advice for finding ML/AI use cases
- Getting started with ML/AI? Start here!
So, was there a useful pattern?
Still curious about day 61? Turns out there *is* a pattern in the toy data I made for this example. I know this because I put it there. I can even promise you that it generalizes to day The-Biggest-Number-You-Can-Think-Of-Plus-One because in these wildly nonstationary times, I find it luxuriously comforting to work with data that plays nice for a change.
#The data:
(1,28)  (2,17)  (3,92)  (4,41)  (5,9)   (6,87)  (7,54) (8,3)   (9,78)  (10,67) (11,1)  (12,67) (13,78) (14,3) (15,55) (16,86) (17,8)  (18,42) (19,92) (20,17) (21,29) (22,94) (23,28) (24,18) (25,93) (26,40) (27,9)  (28,87) (29,53) (30,3)  (31,79) (32,66) (33,1)  (34,68) (35,77) (36,3)  (37,56) (38,86) (39,8)  (40,43) (41,92) (42,16) (43,30) (44,94) (45,27) (46,19) (47,93) (48,39) (49,10) (50,88) (51,53) (52,4)  (53,80) (54,65) (55,1)  (56,69) (57,77) (58,3)  (59,57) (60,86) ...
For those who like a challenge, why don’t you try see if your favorite machine learning algorithm can find the pattern and turn it into a useful recipe? (Answer at the bottom of this page.)
I also suspect that there might be more folks who get it with an analytics approach instead of using machine learning (see this to understand the difference, plus the clue I’ve just given you) but GLHF. May the best approach win!
If you’re keen to try ML, don’t forget to do things in the right order — here’s a step-by-step guide to help you out.
Thanks for reading!
If you’re keen to read more of my writing, most of the links in this article take you to my other musings. You can also enjoy audio versions here and my statistics video playlist here.
Footnote
If you’re curious to see the answer for day 61, try running the R function that I used to generate the data (you can paste it in and run it online here).
# Here's the R code I used to generate the data:
doseFun <- Vectorize(function(x) {r <- round(93 * cos(x) ^ 2 + sqrt(exp(x/100))); return(r)})# Output the result for day 61:
print(doseFun(61))# Plot the deterministic function:
plot(x = 1:60, y = doseFun(1:60))
Because my function turned out to be deterministic, you could have gotten the right answer by analytics (plotting the graph and eyeballing it to notice the repeating pattern) and you didn’t really need machine learning here, though it can work anyway. It’s just not the most efficient way to go about things.
For an example of a simple machine learning approach in a deterministic setting, see my video below:
Warning!
I hope I haven’t done more harm than good by exposing you to that toy dataset. The danger is that you learn a very bad habit: failure to split your data and test your system properly.
Those of you who split the data and validated your solution before submitting it deserve an extra pat on the back. Your caution will serve you well!
Those of you who plotted/trained on the entire dataset may have gotten away with it… this time. The only reason you didn’t get suckerpunched by this cartoonish example is that the true underlying model was a simple pattern which could be extracted easily from the data. These are rare in practice, since your colleagues probably found all such low-hanging fruit decades ago. If you approach real world data the way you just approached this toy example, you’ll get hurt. You can find more info about that in my article How to be an AI idiot.
임상 시험에서 얻은 데이터 세트 를 방금 관리했다고 상상해보십시오 . 신난다! 캐릭터를 이해하는 데 도움이되도록 몇 가지 데이터를 만들었습니다.
이러한 데이터 포인트 가 치료 일 ( 입력 "특징 " )과 환자가 60 일 동안 받아야하는 기적 치료 의 정확한 용량 (밀리그램 단위) ( 출력 "예측 " ) 사이의 관계를 매핑 한다고 가정합니다.


# 데이터 :
(1,28) (2,17) (3,92) (4,41) (5,9) (6,87) (7,54) (8,3) (9,78) ( 10,67) (11,1) (12,67) (13,78) (14,3) (15,55) (16,86) (17,8) (18,42) (19,92) ( 20,17) (21,29) (22,94) (23,28) (24,18) (25,93) (26,40) (27,9) (28,87) (29,53) ( 30,3) (31,79) (32,66) (33,1) (34,68) (35,77) (36,3) (37,56) (38,86) (39,8) ( 40,43) (41,92) (42,16) (43,30) (44,94) (45,27) (46,19) (47,93) (48,39) (49,10) ( 50,88) (51,53) (52,4) (53,80) (54,65) (55,1) (56,69) (57,77) (58,3) (59,57) ( 60,86) ...
이제 당신이 환자를 치료하고 있고 2 일째라고 상상해보십시오. 우리는 어떤 복용량을 사용하도록 제안합니까?
정말 호 p는 당신이 대답 전자 "17mg을" 이것은 확실히 트릭 질문 있어야되지 않았습니다 때문이다. 4 일차는 어떻습니까? 41mg ? 그렇습니다!
이제 1 ~ 5 일에 적절한 용량을 출력하는 소프트웨어를 어떻게 구축 하시겠습니까? 기계 학습 (ML) 을 사용 하시겠습니까 ? 즉, 이러한 데이터에서 패턴을 찾아 입력에서 출력으로 이동하기위한 레시피 ( "모델" ) 로 바꾸려고 시도 하시겠습니까?
아니, 당연하지 않을거야! 당신은 당신이하고있는 일을 정확히 수행하도록 소프트웨어를 얻게 될 것입니다. 표에서 답을 찾으십시오. 이렇게하면 60 일 내내 100 % 정답을 얻을 수 있습니다. 여기에는 패턴이 필요하지 않으며 기계 학습도 필요하지 않습니다.
그렇다면 기계 학습이 필요한 상황은 무엇일까요?
지금은 어때? 61 일째입니다. 여기서 정답은 무엇입니까?
음, 61 일째 데이터를 본 적이 없으므로 여기서 답을 찾을 수있는 방법이 없습니다. 우리는 무엇을 할 수 있습니까? 운이 없습니까? 기계 학습이 도움이 될 수 있습니까?
조건에 따라서.
입력과 출력을 연결하는 패턴이 없다면 잊어 버리십시오. 이 경우, 우리를 도울 수있는 것은 아무것도 없습니다. 존재하지 않는 실제 마법이 부족 합니다 (기계 학습이 그랬다고 생각한 경우). 지금 포기하세요!
유용한 패턴을 찾아야합니다
그러나이 경우 입니다 패턴과 경우 우리가 그것을 찾을 수있는 (즉, 만약 큰이야!), 우리는 / 예측 정답을 추측하려고 하루 (61)에 적용을 시도 할 수 있습니다. 기계 학습이 도움이 될 수 있습니다.
패턴은 일반화되어야합니다.
문제는 데이터에 패턴이있는 것만으로는 충분하지 않다는 것입니다. 그것은 너무 편리 할 것입니다. 이 패턴은 60 일 이후에도 관련이 있어야합니다. 61 일에 조건이 근본적으로 다르면 패턴이 일반화 되지 않으면 어떻게 될까요? 아시다시피 61 일째에 모든 환자가 완전히 치료되었거나 사망했거나 호환되지 않는 약물을 복용 중입니다. 그렇다면 패턴은 당신에게 좋지 않습니다.
비정상 우주
데이터가 내일의 세계에 대한 유용한 창이 아니라면 (아마도 전염병이 모든 규칙을 변경했기 때문에) 어제 정보가 얼마나 좋았던지는 중요하지 않습니다. 만약 당신이 우주의 불안정한 구석에 살고 있다면, 우리가 에르 고딕 성과 정상 성 가정 이라고 부르는 것을 정당화하는 데 어려움을 겪을 것 입니다. 이는 대략 "규칙이 변경되지 않았다고 생각합니다"로 번역됩니다 .
나는 보는 사람의 눈에있는 일종의 비정상성에 대해 말하는 것이 아닙니다 (예를 들어, 인플레이션 조정을 잊었 기 때문에 평균 가격이 시간이 지남에 따라 표류하는 것처럼 보일 때). 규칙이 예측 가능한 시간 함수 인 경우 부드러운 비정상 성을 다루는 것은 시계열 분석 분야의 모든 것입니다.
시스템의 규칙이 한 기간에서 다음 기간으로 예측할 수없는 방식으로 근본적으로 다르기 때문에 아무것도 할 수없는 폭력적인 비정상성에 대해 이야기하고 있습니다. 과거 데이터가 갑자기을 전혀 적용하지 않으면 비정상 미래, 당신은 진지한 얼굴로 내일을 예측하기 위해 어제 사용할 수 없습니다 것입니다.
아마도 당신은 운이 좋을 것입니다
이 경우 그러나 인 패턴 과 이 패턴은 새로운 상황에 관련된 경우 우리가 우리 자신을에서 찾을 수 있습니다, 우리는 사업에있어. 우리는 이전 데이터에서 패턴을 찾아이를 기반으로 레시피를 만든 다음 해당 레시피를 사용하여 61 일 이후에 성공할 수 있습니다!
패턴을 찾고 사용하는 것이 기계 학습의 전부입니다.
기계 학습을 사용하는 경우
에서 응용 기계 학습 (및 AI ), 당신은 당신이 전에 본 적이 기억 예를 역류의 사업에 아니에요 - 당신은 단지 그들을 찾아, 그것을위한 ML이 필요하지 않습니다! -배우기 위해 여기에 있습니다.
이전 답변을 반복 하시겠습니까? ML이 더 잘할 수 있습니다! 새로운 사례에서 성공합니다.
당신의 임무는? 성공적으로 일반화 되는 솔루션을 빌드하려면 (또는 프로젝트에서 플러그를 뽑으십시오). (“성공적으로”란 무엇을 의미합니까? 해당 주제에 대한 전체 가이드가 있습니다 .)
즉, 이전에 본 적이없는 새로운 예제를 처리 할 수 없다면 솔루션이 좋지 않습니다 . 고정 우주의 모든 규칙을 깨뜨리는 극적으로 새로운 예는 아니지만 학습 된 주제에 약간의 왜곡이 있습니다.
우리는 앵무새처럼 암기하기 위해 여기있는 것이 아닙니다. 우리는 새로운 상황을 일반화하기 위해 여기에 있습니다. 이것이 바로 기계 학습의 힘과 아름다움입니다.
(61 일) 이전에 입력 값의 정확한 조합을 보지 못했다 면 올바른 출력 답은 무엇입니까? 글쎄, 아마도 우리는 오래된 패턴을 적절한 추측을 만드는 레시피로 바꿀 수 있습니다.
예를 들어 수천 장의 동물 사진에서 고양이 / 고양이가 아닌 분류기 를 훈련 한 경우 새 사진에 고양이가 있는지 알려주도록 요청할 수 있지만 그림이 있는지 묻지 않아야합니다. 입체파 스타일입니다.
기계 학습이 적합합니까?
내가 그것을 사물 라벨러 라고 부르고 코드 작성에 대한 대안적인 접근 방식 이라고 부르는 것이 지겹다 면 다른 방식으로 시도해 보겠습니다.
기계 학습은 반복되는 의사 결정 자동화 포함하는 알고리즘 적으로 패턴 찾기 새로운 데이터를 올바르게 처리하는 레시피를 만드는 데 사용합니다.
기계 학습이 당신을위한 것인지 알기 위해, 당신이 좋아할만한 세 가지 가이드가 있습니다.
그래서 유용한 패턴이 있었나요?
61 일째가 아직도 궁금하세요? 이 예제를 위해 제가 만든 장난감 데이터에 패턴이 * 있습니다 *. 나는 그것을 거기에 두었 기 때문에 이것을 알고 있습니다. 이처럼 불안정하지 않은이 시대에 변화에 잘 맞는 데이터로 작업하는 것이 사치스럽게 편안함을 느끼기 때문에 이것이 오늘 The-Biggest-Number-You-Can-Think-Of-Plus-One으로 일반화된다고 약속 할 수도 있습니다.
# 데이터 :
(1,28) (2,17) (3,92) (4,41) (5,9) (6,87) (7,54) (8,3) (9,78) ( 10,67) (11,1) (12,67) (13,78) (14,3) (15,55) (16,86) (17,8) (18,42) (19,92) ( 20,17) (21,29) (22,94) (23,28) (24,18) (25,93) (26,40) (27,9) (28,87) (29,53) ( 30,3) (31,79) (32,66) (33,1) (34,68) (35,77) (36,3) (37,56) (38,86) (39,8) ( 40,43) (41,92) (42,16) (43,30) (44,94) (45,27) (46,19) (47,93) (48,39) (49,10) ( 50,88) (51,53) (52,4) (53,80) (54,65) (55,1) (56,69) (57,77) (58,3) (59,57) ( 60,86) ...
도전을 좋아하는 사람들을 위해 좋아하는 기계 학습 알고리즘 이 패턴을 찾아서 유용한 레시피로 바꿀 수 있는지 확인하는 것이 어떻습니까? (이 페이지 하단에 답변하십시오.)
나는 또한 대신에 기계 학습을 사용하는 접근 웹 로그 분석으로 얻을 더 많은 사람들이있을 수 있다고 생각합니다 ( 이 차이를 이해하기 위해, 플러스 단서가 난 그냥 당신이 준)하지만 GLHF을. 최선의 접근 방식이 이길 수 있습니다!
ML을 사용 해보고 싶다면 올바른 순서로 작업하는 것을 잊지 마십시오. 여기 에 도움이되는 단계별 가이드 가 있습니다.
읽어 주셔서 감사합니다!
내 글을 더 많이 읽고 싶다면이 기사의 대부분의 링크를 통해 내 다른 묵상으로 이동합니다. 또한 오디오 버전을 즐길 수 있습니다 여기에 비디오 재생 목록을 내 통계 여기 .
각주
61 일째에 대한 답이 궁금하다면 데이터를 생성하는 데 사용한 R 함수를 실행 해보십시오 ( 여기 에 붙여넣고 온라인 에서 실행할 수 있음 ).
# 데이터 생성에 사용한 R 코드는 다음과 같습니다.
doseFun <-Vectorize (function (x) {r <-round (93 * cos (x) ^ 2 + sqrt (exp (x / 100))); return (r )})# 61 일째 결과 출력 :
print (doseFun (61))# 결정 론적 함수를
플로팅 합니다 : plot (x = 1:60, y = doseFun (1:60))
내 기능이 결정론적인 것으로 판명 되었기 때문에 분석 (그래프를 플로팅하고 반복되는 패턴을 알아 차리기 위해 눈을 뗄 수 있음)을 통해 정답을 얻을 수 있었고 어쨌든 작동 할 수는 있지만 여기서는 머신 러닝이 실제로 필요하지 않았습니다 . 일을 처리하는 가장 효율적인 방법은 아닙니다.
결정 론적 설정에서 간단한 기계 학습 접근 방식의 예는 아래 비디오를 참조하십시오.
경고!
그 장난감 데이터 셋에 당신을 노출 시켜서 좋은 것보다 더 많은 해를 끼치 지 않았기를 바랍니다. 위험은 데이터 를 분할 하고 시스템을 제대로 테스트 하지 못하는 매우 나쁜 습관을 배우는 것입니다.
데이터를 분할하고 솔루션을 제출하기 전에 유효성을 검증 한 사람들은 뒷면에 추가로 칭찬받을 만합니다. 당신의주의는 당신을 잘 섬길 것입니다!
전체 데이터 세트에 대해 플로팅 / 트레이닝 한 분들은이 문제를 해결하지 못했을 것입니다 . 이번에는 . 이 만화 같은 예에서 멍청하지 않은 유일한 이유는 진정한 기본 모델이 데이터에서 쉽게 추출 할 수있는 단순한 패턴 이었기 때문입니다. 동료들은 아마도 수십 년 전에 이러한 모든 낮은 열매를 발견했기 때문에 실제로는 드뭅니다. 이 장난감 예제에 방금 접근 한 방식으로 실제 데이터에 접근하면 다칠 것입니다. 내 기사 에서 AI 바보가되는 방법에 대한 자세한 정보를 찾을 수 있습니다 .
[출처] https://towardsdatascience.com/when-not-to-use-machine-learning-or-ai-8185650f6a29
광고 클릭에서 발생하는 수익금은 모두 웹사이트 서버의 유지 및 관리, 그리고 기술 콘텐츠 향상을 위해 쓰여집니다.
댓글 0
| 번호 | 제목 | 글쓴이 | 날짜 | 조회 수 |
|---|---|---|---|---|
| 공지 | 오라클 기본 샘플 데이터베이스 | 졸리운_곰 | 2014.01.02 | 86098 |
| 공지 | [SQL컨셉] 서적 "SQL컨셉"의 샘플 데이타 베이스 SAMPLE DATABASE of ORACLE | 가을의 곰을... | 2013.02.10 | 78617 |
| 공지 | [G_SQL] Sample Database | 가을의 곰을... | 2012.05.20 | 95332 |