
This post on R Views is about… Python! Surprising, I know. Python has several well-written packages for statistics and data science, but CRAN, R’s central repository, contains thousands of packages implementing sophisticated statistical algorithms that have been field-tested over many years. Thanks to the rpy2 package, Pythonistas can take advantage of the great work already done by the R community. rpy2 provides an interface that allows you to run R in Python processes. Users can move between languages and use the best of both programming languages.
Below, I walk you through how to call three powerful R packages from Python: stats, lme4, and ggplot2. Each section contains detailed steps, and you can find the complete script in the appendix.
Getting started with rpy2
Installing rpy2
First up, install the necessary packages. You must have Python >=3.7 and R >= 4.0 installed to use rpy2 3.5.2. Once R is installed, install the rpy2 package by running pip install rpy2. If you’d like to see where you installed rpy2 on your machine, you can run python -m rpy2.situation.
If you are working in a Jupyter notebook, you may want to see your ggplot2 plots within your notebook. Run conda install r-ggplot2 in your Jupyter environment so that they show up.
Installation
pip install rpy2
conda install r-ggplot2
Importing rpy2 packages and subpackages
Then, you’ll import the packages and subpackages. Import the top-level rpy2 package by running import rpy2.
Import the top-level subpackage robjects with import rpy2.robjects as robjects. Running robjects also initializes R in the current Python process.
There are a couple of other steps to make working in a notebook a bit easier:
- rpy2 customizes the display of R objects, such as data frames in a notebook. Run
rpy2.ipython.html.init_printing()to enable this customization. - You may want to see ggplot2 objects in an output cell of a notebook. Enable this with
from rpy2.ipython.ggplot import image_png.
Import rpy2 packages and subpackages
import rpy2
import rpy2.robjects as robjects

## To aid in printing HTML in notebooks
import rpy2.ipython.html
rpy2.ipython.html.init_printing()

## To see plots in an output cell
from rpy2.ipython.ggplot import image_png
Installing and loading R packages with rpy2
Installing and loading R packages are often the first steps in R scripts. The rpy2 package provides a function rpy2.robjects.packages.importr() that mimics these steps. Run the below, where you’ll also import the function data() for later.
from rpy2.robjects.packages import importr, data
Use importr() to load the utils and base packages, which normally come preinstalled with R.
utils = importr('utils')
base = importr('base')
You can also download and install packages from a package repository (such as CRAN) with rpy2.
First, select your desired mirror with utils.chooseCRANmirror() and install your packages with utils.install_packages(). Below, you will install stats and lme4.
utils.install_packages('stats')
utils.install_packages('lme4')
Once installed, load the packages with importr().
stats = importr('stats')
lme4 = importr('lme4')
Installing and loading ggplot2 with rpy2
The rpy2 documentation recommends a different method for installing ggplot2:
import rpy2.robjects.lib.ggplot2 as ggplot2
Installation of R packages
from rpy2.robjects.packages import importr, data

utils = importr('utils')
base = importr('base')

utils.chooseCRANmirror(ind=1)
utils.install_packages('lme4')
utils.install_packages('stats')

stats = importr('stats')
lme4 = importr('lme4')

import rpy2.robjects.lib.ggplot2 as ggplot2
Using the Python interface for R
With everything set up, you can begin using the Python interface! However, this is not as simple as writing R code in your Jupyter notebook. You have to ‘translate’ R functions to call them from Python.
Below, I analyze the sleepstudy data from lme4. The data represents the average reaction time per day (in milliseconds) for subjects in a sleep deprivation study. On days 0-1, the subjects had their regular amount of sleep. Day 2 was baseline, after which sleep deprivation started.
Working with data in rpy2
You can ‘fetch’ data from R packages with rpy2. The code below is the equivalent to lme4::sleepstudy in R. Notice you use the data() function imported earlier:
sleepstudy = data(lme4).fetch('sleepstudy')['sleepstudy']
sleepstudy
| Reaction | Days | Subject | ||
|---|---|---|---|---|
| 0 | 1 | 249.56 | 0.0 | 308 |
| 1 | 2 | 258.7047 | 1.0 | 308 |
| 2 | 3 | 250.8006 | 2.0 | 308 |
| 3 | 4 | 321.4398 | 3.0 | 308 |
| 4 | 5 | 356.8519 | 4.0 | 308 |
| 5 | 6 | 414.6901 | 5.0 | 308 |
| 6 | 7 | 382.2038 | 6.0 | 308 |
| 7 | 8 | 290.1486 | 7.0 | 308 |
| ... | ... | ... | ... | ... |
| 178 | 179 | 369.1417 | 8.0 | 372 |
| 179 | 180 | 364.1236 | 9.0 | 372 |
Visualizing data with ggplot2 from Python
The ggplot2 package provides flexible and robust functionality for creating graphics. We can plot our data in Python with a few tweaks to the usual ggplot2 syntax.
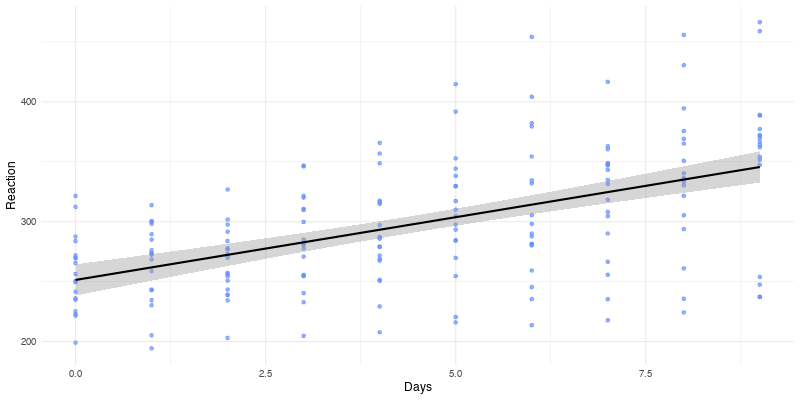
Visualize the relationship between days and reaction time from the sleep study:
gp = ggplot2.ggplot(sleepstudy)

p1 = (gp +
      ggplot2.aes_string(x = 'Days', y = 'Reaction') +
      ggplot2.geom_point(color = '#648FFF', alpha = 0.7) +
      ggplot2.geom_smooth(method = 'lm', color = 'black') +
      ggplot2.theme_minimal())

display(image_png(p1))
R[write to console]: `geom_smooth()` using formula 'y ~ x'


Running models and viewing results with rpy2
You can leverage R’s statistical capabilities in Python. Call the lm() function from the stats package to write a linear model with rpy2:
lm1 = stats.lm('Reaction ~ Days', data = sleepstudy)
# print(base.summary(lm1))
Printing the fit object with print(base.summary(lm1)) displays both the code used to perform the fit and the results. For brevity, limit the output to the coefficients:
print(stats.coef(lm1))
(Intercept)        Days
  251.40510    10.46729
Print the 95% confidence intervals as well:
print(stats.confint(lm1))
                 2.5 %    97.5 %
(Intercept) 238.360753 264.44946
Days          8.023855  12.91072
The results show that the more days of sleep deprivation, the slower the reaction time. However, you may realize that the linear model disguises the variation across the study’s subjects. To illustrate these differences, you can plot Reaction vs. Days for each subject separately with ggplot2’s facet_wrap():
p2 = (p1 +
      ggplot2.facet_wrap(robjects.Formula('. ~ Subject'), **{'ncol':6}))

display(image_png(p2))
R[write to console]: `geom_smooth()` using formula 'y ~ x'
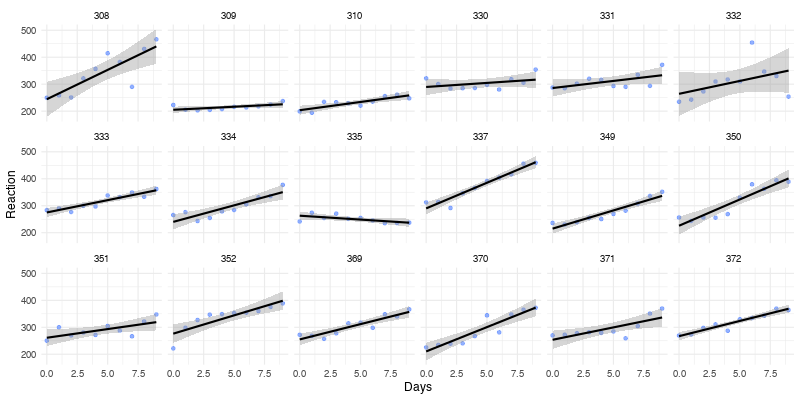
The plots show that the average reaction time increases approximately linearly with the number of sleep-deprived days. However, the slope and intercept vary by subject.
You can use the lme4 package to create a model that calculates the fixed effects of days of sleep deprivation on reaction time while considering starting reaction time and differences for each individual.
fm1 = lme4.lmer('Reaction ~ Days + (Days | Subject)', data = sleepstudy)
print(base.summary(fm1))
Here is the output from summary, abbreviated to the results:
REML criterion at convergence: 1743.6

Scaled residuals:
    Min      1Q  Median      3Q     Max
-3.9536 -0.4634  0.0231  0.4634  5.1793

Random effects:
 Groups   Name        Variance Std.Dev. Corr
 Subject  (Intercept) 612.10   24.741
          Days         35.07    5.922   0.07
 Residual             654.94   25.592
Number of obs: 180, groups:  Subject, 18

Fixed effects:
            Estimate Std. Error t value
(Intercept)  251.405      6.825  36.838
Days          10.467      1.546   6.771

Correlation of Fixed Effects:
     (Intr)
Days -0.138
The estimates of the standard deviations of the random effects for the intercept and the slope are 24.74 ms and 5.92 ms/day. The fixed-effects coefficients are 251.4 ms and 10.47 ms/day for the intercept and slope. These results match the ones output by R.1
Learning how to use rpy2
Working with rpy2 took investigative work. There were R functions that I assumed would be straightforward to translate to Python but they turned out to be more complicated.
For example, I wanted to confirm that each subject had different linear model results. The subset() function is part of base R, so I thought I could run:
lm1 = stats.lm('Reaction ~ Days', data = base.subset(sleepstudy, Subject == 308))
Unfortunately, this is incorrect. I found the answer reading the Extracting items section of the documentation. After learning how rpy2 works with R data frames, I was able to find the actual way to subset the data:
lm308 = stats.lm('Reaction ~ Days', data = sleepstudy.rx(sleepstudy.rx('Subject').ro == 308, True))
print(stats.confint(lm308))
                 2.5 %    97.5 %
(Intercept) 179.433863 308.95148
Days          9.634267  33.89514
You will need knowledge of Python for more flexibility with the rpy2 interface. For instance, the ability to define the number of columns with **{'ncol':6} in facet_wrap() above was not in the rpy2 documentation. Unpacking values with keyword arguments, denoted by **{}, is part of the general Python syntax.
Learn more
There are many ways that Python users can leverage R packages and functions in their scripts. The rpy2 is a helpful tool for those who want to use the R community’s impactful work. As stated in the rpy2 documentation, “Reuse. Get things done. Don’t reimplement.”
- Read the official documentation.
- The documentation includes help on using rpy2 in notebooks.
- Check out the lme4 vignette.
Appendix
# Installation
pip install rpy2
conda install r-ggplot2

# Import rpy2 packages and subpackages
import rpy2
import rpy2.robjects as robjects

## To aid in printing HTML in notebooks
import rpy2.ipython.html
rpy2.ipython.html.init_printing()

## To see plots in an output cell
from rpy2.ipython.ggplot import image_png

# Installation of R packages
from rpy2.robjects.packages import importr, data

utils = importr('utils')
base = importr('base')

utils.chooseCRANmirror(ind=1)
utils.install_packages('lme4')
utils.install_packages('stats')

stats = importr('stats')
lme4 = importr('lme4')

import rpy2.robjects.lib.ggplot2 as ggplot2

# Working with data in rpy2
sleepstudy = data(lme4).fetch('sleepstudy')['sleepstudy']
sleepstudy

# Visualizing with ggplot2 in Python
gp = ggplot2.ggplot(sleepstudy)

p1 = (gp +
      ggplot2.aes_string(x = 'Days', y = 'Reaction') +
      ggplot2.geom_point(color = '#648FFF', alpha = 0.7) +
      ggplot2.geom_smooth(method = 'lm', color = 'black') +
      ggplot2.theme_minimal())

display(image_png(p1))

p2 = (p1 +
      ggplot2.facet_wrap(robjects.Formula('. ~ Subject'), **{'ncol':6}))

display(image_png(p2))

# Run models and view results
lm1 = stats.lm('Reaction ~ Days', data = sleepstudy)
print(stats.coef(lm1))
print(stats.confint(lm1))

fm1 = lme4.lmer('Reaction ~ Days + (Days | Subject)', data = sleepstudy)
print(base.summary(fm1))
- Douglas Bates, Martin Maechler, Ben Bolker, Steve Walker (2015). Fitting Linear Mixed-Effects Models Using lme4. Journal of Statistical Software, 67(1), 1-48. doi:10.18637/jss.v067.i01. ↩
