
- 전체
- Sample DB
- database modeling
- [표준 SQL] Standard SQL
- G-SQL
- 10-Min
- ORACLE
- MS SQLserver
- MySQL
- SQLite
- postgreSQL
- 데이터아키텍처전문가 - 국가공인자격
- 데이터 분석 전문가 [ADP]
- [국가공인] SQL 개발자/전문가
- NoSQL
- hadoop
- hadoop eco system
- big data (빅데이터)
- stat(통계) R 언어
- XML DB & XQuery
- spark
- DataBase Tool
- 데이터분석 & 데이터사이언스
- Engineer Quality Management
- [기계학습] machine learning
- 데이터 수집 및 전처리
- 국가기술자격 빅데이터분석기사
- 암호화폐 (비트코인, cryptocurrency, bitcoin)
[실시간 분석 시스템] Apache Flume를 활용한 데이터 수집(2)
2017.03.06 12:58
[실시간 분석 시스템] Apache Flume를 활용한 데이터 수집(2)
이전 글에서 Apache Flume의 기본 개념,구성에 대해서 알아봤다. 이어서, 이번 글에서는 Flume을 통해 수집하는 구성과 간단한 예제 및 수집모니터링에 대해 작성하고자 한다.
Flume 확장 구성
로그를 발생시키는 여러 서버들로 부터 수집을 하고, 용도에 맞게 여러 곳으로 이벤트를 전달 저장하는 구조는 아래와 같은 경우가 있을 수 있다.
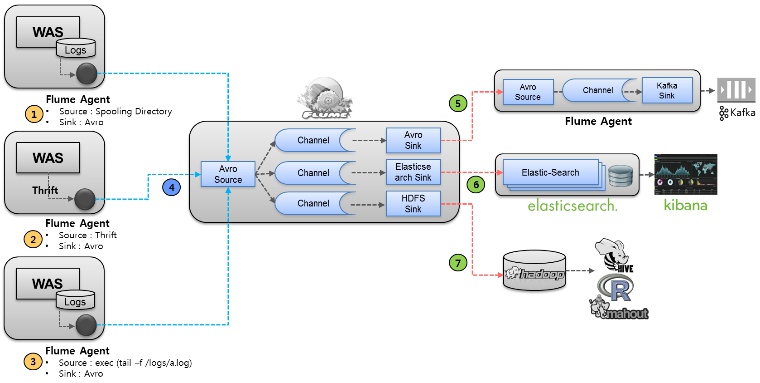
위 그림에서와 같이 Flume Agent를 바탕으로 Complex flow를 만들수 있다. 이른바, Fan-in, Fan-out한 구조인데,
1. Spooling Directory Source : WAS의 Log 파일 위치의 디렉토리를 Spooling하여 파일이 만들어졌을때를 모니터링하여 수집
2. Thrift Source : WAS에서 로그를 파일로 별도로 남기지 않고, Thrift 통신으로 직접 Agent에 발송하여 로그 수집
3. Exec Source : WAS의 로그파일을 tailing하여 로그 수집
4. Avro Source : 각 WAS에서 수집된 로그를 Avro 통신을 통해 로그를 중간 집적서버로 전송, Avro Source를 통해 들어온 이벤트를 Channel selector를 통해 각각의 Channel로 전송
5. Avro Sink : 또 다른 Agent 서버로 이벤트를 Avro 통신을 통해 전송하여, 해당 Agent는 Kafka Sink를 통해 분산 메시징 큐인 Kafka로 저장하여, 필요한 Application에서 메시지 가져갈 수 있게 준비함. 일반적으로 실시간 처리를 하기 위해 많이 활용된다.
6. Elasticsearch Sink : 오픈소스 검색엔진인 Elastic-Search 로 Sink하여 Kibana와 같은 로그 통계,모니터링을 통해 서비스 가능
7. Hadoop Sink : 대용량 분산 저장을 위해 HDFS(Hadoop Distributed File System))로 저장하여, Hive,Pig,R,Mahout 등으로 배치 분석,기계어 학습 등에 활용
참고로 2->4->5의 Flow를 통해 CEP 아키텍처 기반의 실시간 처리가 가능한 엔진으로 전달하면 Realtime 수집,분석을 할 수 있다.
Flume 구성 예제
아래와 같이 꼭 구성할 필요는 없지만, 설명을 위해 아래 구성을 통해 수집을 해보자.
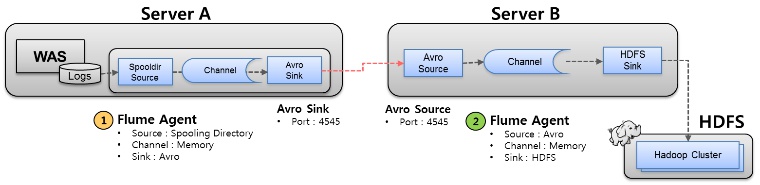
두개의 서버에 각각 Flume Agent가 설치되어 있다. 상세 내용은 아래와 같다.
1. 로그가 발생하는 WAS서버내 수집 Agent
- Spooling Directory Source : WAS 로그 디렉토리를 Spooling
- Memory Channel
- Avro Sink : Server B로 Avro 통신을 통해 이벤트 전송
2. 로그를 수집하는 별도 수집서버 내 Agent
- Avro Source : Server A로 부터 Avro통신을 통해 이벤트 수진
- Memory Channel
- HDFS Sink : 수집된 이벤트를 HDFS에 저장
3. 수집된 데이터를 저장하기 위한 HDFS(Hadoop Distributed File System))
각각의 configuration을 보면 아래와 같다.
1. Server A의 flume.conf ################################################# agentDataSource.sources = otvSource agentDataSource.channels = otvChannel agentDataSource.sinks = avroSink # Source : Spooling Directory agentDataSource.sources.otvSource.type = spooldir agentDataSource.sources.otvSource.channels = otvChannel agentDataSource.sources.otvSource.spoolDir = /data/daisy/logs # Sink : Avro agentDataSource.sinks.avroSink.type = avro agentDataSource.sinks.avroSink.channel = otvChannel agentDataSource.sinks.avroSink.hostname = 0.0.0.1 agentDataSource.sinks.avroSink.port = 4545 # Channel : Memory agentDataSource.channels.otvChannel.type = memory agentDataSource.channels.otvChannel.capacity = 100 ################################################# *) Server A의 Flume 구동 % /home/daisy/flume/bin/flume-ng agent -c conf -f /home/daisy/flume/ conf/flume.conf --name agentDataSource \ -Dflume.root.logger=DEBUG,console -Xmx512m -Xms100m -Dlog4j. configuration=file:/home/daisy/flume/conf/log4j.properties \ -Dflume.monitoring.type=http -Dflume.monitoring.port=12346 &
2. Server B의 flume.conf ################################################# agentDataCollector.sources = targetSource agentDataCollector.channels = targetChannel agentDataCollector.sinks = targetSink # Source : Avro agentDataCollector.sources.targetSource.type = avro agentDataCollector.sources.targetSource.channels = targetChannel agentDataCollector.sources.targetSource.bind = 0.0.0.1 agentDataCollector.sources.targetSource.port = 4545 # Sink : HDFS agentDataCollector.sinks.targetSink.type = hdfs agentDataCollector.sinks.targetSink.channel = memoryChannel agentDataCollector.sinks.targetSink.hdfs.path = hdfs://daisy01:9000/data/stats/%Y-%m-%d/%H agentDataCollector.sinks.targetSink.hdfs.fileType = DataStream agentDataCollector.sinks.targetSink.writeFormat = Text agentDataCollector.sinks.targetSink.hdfs.filePrefix = access_log agentDataCollector.sinks.targetSink.hdfs.fileSuffix = .log agentDataCollector.sinks.targetSink.hdfs.threadsPoolSize = 10 agentDataCollector.sinks.targetSink.hdfs.rollInterval = 30 agentDataCollector.sinks.targetSink.hdfs.round = false local_agent.sinks.localHdfsSink.hdfs.roundValue = 5 local_agent.sinks.localHdfsSink.hdfs.roundUnit = minute # for test & tmp backup agentDataCollector.sinks.targetSink.type = file_roll agentDataCollector.sinks.targetSink.channel = targetChannel agentDataCollector.sinks.targetSink.sink.directory = /data/tmp # Channel : Memory agentDataCollector.channels.targetChannel.type = memory agentDataCollector.channels.targetChannel.capacity = 100 ################################################# *) Server B의 Flume 구동 % /home/daisy/flume/bin/flume-ng agent -c conf -f /home/daisy/flume/ conf/flume.conf --name agentDataCollector \ -Dflume.root.logger=DEBUG,console -Xmx512m -Xms100m -Dlog4j. configuration=file:/home/daisy/flume/conf/log4j.properties \ -Dflume.monitoring.type=http -Dflume.monitoring.port=12345 &


수집상태 모니터링
Flume 을 통해 수집상태를 모니터링하고자 할때 Flume은 아래 타입들이 지원된다.
1. Ganglia
- Ganglia Monitoring Daemon (gmond)
- -Dflume.monitoring.type=gangla 등 몇가지 Property 적용으로 가능
- Ganglia Monitoring System : http://ganglia.sourceforge.net/
2. internal HTTP server
위 Start Shell을 자세히 보면 "-Dflume.monitoring.type=http -Dflume.monitoring.port=12345" 값이 있다.
내장된 http 서버로 해당 포트를 통해 JSON형태의 정보가 제공된다.
예를들어 http://localhost:12345/metrics 호출하면 아래와 같은 정보가 보인다.
{ "SINK.avroSink":{ "BatchCompleteCount":"133", "ConnectionFailedCount":"0", "EventDrainAttemptCount":"13300", "ConnectionCreatedCount":"1", "Type":"SINK", "BatchEmptyCount":"0", "ConnectionClosedCount":"0", "EventDrainSuccessCount":"13300", "StopTime":"0", "StartTime":"1398215901251", "BatchUnderflowCount":"0" }, "SOURCE.otvSource":{ "OpenConnectionCount":"0", "Type":"SOURCE", "AppendBatchAcceptedCount":"133", "AppendBatchReceivedCount":"133", "EventAcceptedCount":"13300", "AppendReceivedCount":"0", "StopTime":"0", "StartTime":"1398215901332", "EventReceivedCount":"13300", "AppendAcceptedCount":"0" }, "CHANNEL.otvChannel":{ "EventPutSuccessCount":"13300", "ChannelFillPercentage":"0.0", "Type":"CHANNEL", "EventPutAttemptCount":"13300", "ChannelSize":"0", "StopTime":"0", "StartTime":"1398215901247", "EventTakeSuccessCount":"13300", "ChannelCapacity":"100", "EventTakeAttemptCount":"13301" } }
*) 기타 JMX를 이용하여 모니터링도 가능하다.
이상으로 Flume을 통한 수집에 대해 내용을 마침니다.
[출처]
광고 클릭에서 발생하는 수익금은 모두 웹사이트 서버의 유지 및 관리, 그리고 기술 콘텐츠 향상을 위해 쓰여집니다.
